
When we formed the team to launch SUN ZU Lab, we had mostly one question: how liquid are crypto-assets, and if there is indeed liquidity to be found, to what extent is it different in quantity or quality from what we have seen in traditional markets for 25 years?
“Liquidity is defined as the ability to buy or sell an asset for large size without significant adverse price movement.”
This straightforward question is not so simple and has many ramifications. Indeed if you can qualify and quantify liquidity, then you should be able to execute better (i.e. with smaller adverse price movement). Therefore whoever starts with order book analysis should be ready to go all the way to real-time “smart” order routing.
We are not the ones at SUN ZU to shy away from a challenge like this, so we decided to take the first step and share our results regularly. Among the many insights we will explore and comment, we would like to start with a fundamental element: order book distribution.
The chart below shows how liquidity aggregates (those are excerpts from our first public research report available here) around mid-price. To get a sense of this, we plotted the distribution of orders in the BTC/USD order book for three exchanges (Coinbase, Bitstamp, and Kraken) and averaged the results for the first half of September:
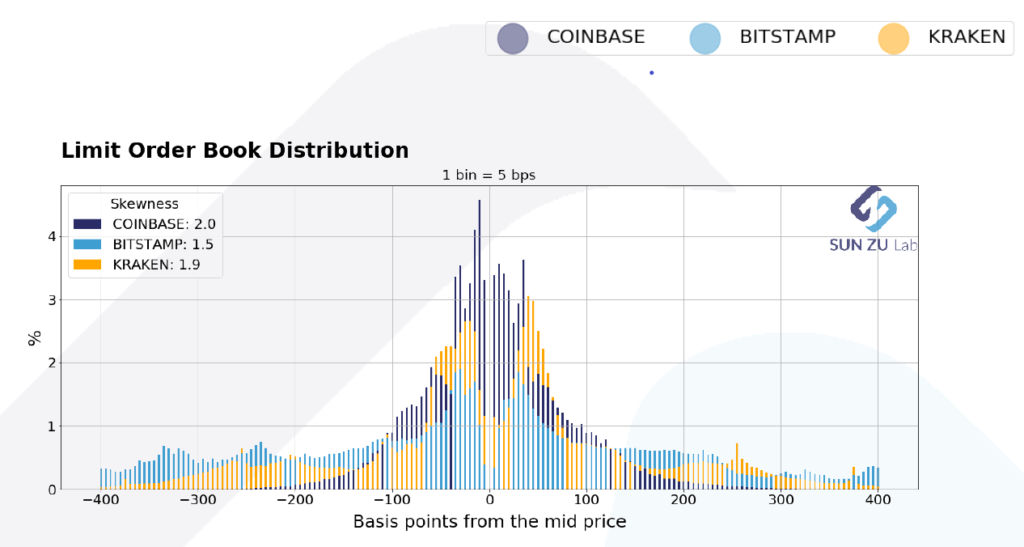
Order book distribution at +/- 400 bps from mid-price. Data from Kaiko.com.
This chart reads as follows: each bar represents the proportion (in %) of orders found at the given distance from mid-price (mid = (bid + ask) / 2). for example a 0.7% bar at -150 bps indicates that 0.7% of all orders in the price interval [-4%; +4%] can be found 1.5% below the mid-price. By construction, for each exchange, the sum of all bars equals 100%.
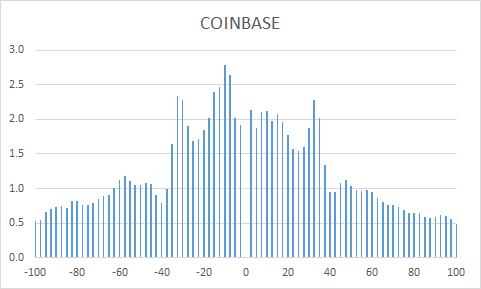
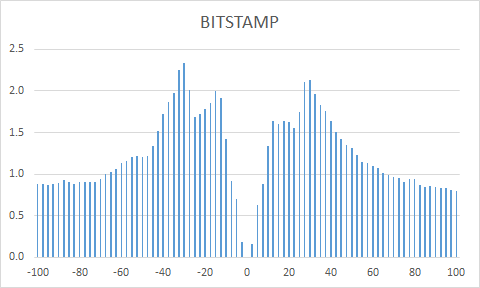
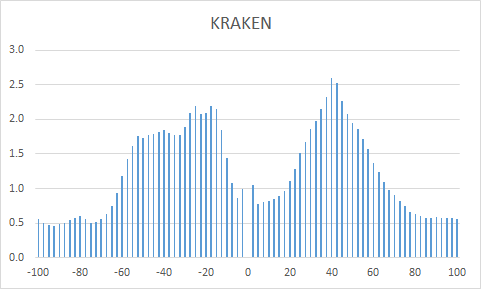
In fact, the above chart is the superposition of three individual pictures:
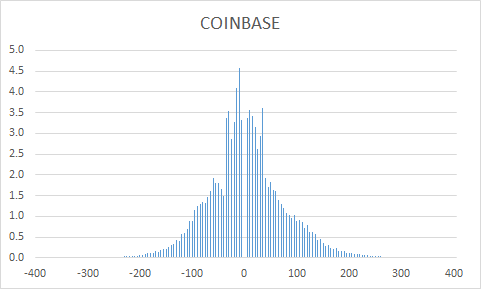
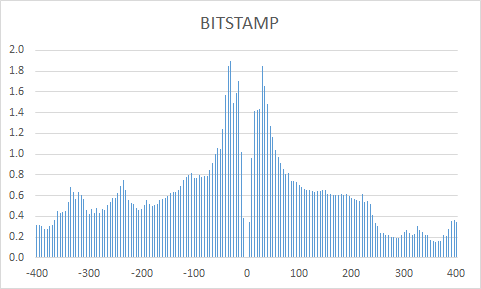
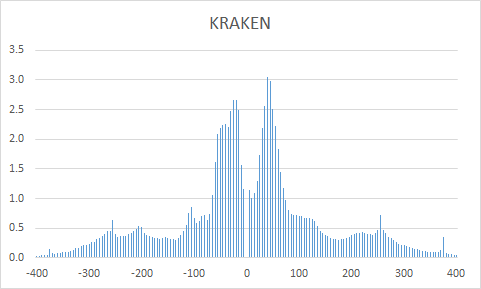
The benefit of layering the three graphs is to present an aggregate view of liquidity, and its partition across the three exchanges, with a single scale and a clear color-coding.
If we focus on a smaller interval, say [-1%; 1%], we get the following distribution:
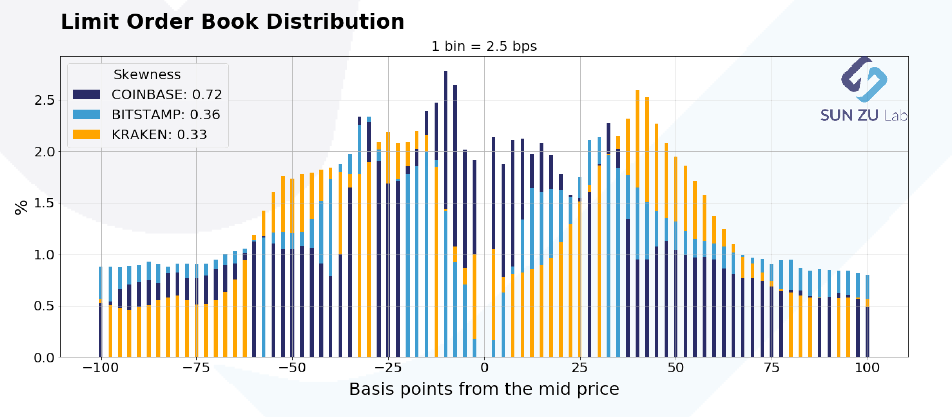
Order book distribution at +/- 100 bps from mid-price. Data from Kaiko.com.
As before, this image is the results of layering three individual charts:
What’s the point of those charts? Why did we choose to aggregate data across exchanges and average through time? Well, the intent is to measure behavioral patterns from investors, on individual exchanges, and across the entire market (represented here by only three exchanges, more are coming). Here are a few points of interest:
- bell-shape curve: does a bell-shape curve make sense? Yes indeed: it is quite intuitive that the density of orders decreases away from the place where the action is taking place i.e. the mid-price. Yet differences are quite obvious when approaching mid-price: in some cases the available size in the book increases, in other cases it decreases. For example, the spread is much narrower on Coinbase than on Bitstamp or Kraken, it almost looks as if investors on Bitstmap wanted to stay away from the first limits in the book. Indeed, we intend to put much more work investigating those questions to deliver qualitative and quantitative insights that can help investors better understand and execute their transactions.
- speed of decay: is there information to be extracted from the speed at which liquidity decays? Absolutely: in a world of high volatility, many investors will want to place orders far away from trading levels to benefit from violent moves. This type of strategy is common in statistical arbitrage, it would be a surprise not to see something similar emerging in crypto-land. The “fatness” of the tails also serves as an indicator of “latent” liquidity i.e. orders waiting to be filled under proper circumstances.
- symmetry: is there a fundamental reason why those distributions should be symmetrical? Well, yes and no. Market makers tend to be symmetrical in the way they place orders. There is little sense in providing liquidity on one side and not the other (if you happen to have a commitment to provide liquidity you don’t have a choice in fact). Native buyers or sellers will on the contrary place themselves on one side or the other. Their relative proportion might therefore alter the symmetry of the order book. However, this relationship is severely weakened in a world where market manipulation is widespread: anybody can put massive orders for no other purpose than “window dressing” the book. Here again, more analysis is required to understand order-book dynamics.
- relative values between exchanges: exchanges have very different order books. Explanations for this can be diverse: fee structure, market-making schemes with specific obligations, more or less stringent market surveillance, minimum trading or maximum holding size, availability of leverage, etc. Because trading on a given exchange still requires fiat and crypto deposits and implies custody risk, comparing liquidity at different exchanges is quite important to choose a few in the many available.
- time-dependency: the data here is for the first half of September. SUN ZU Lab will produce those reports regularly, enabling comparison from one period to the next. If things change, for individual exchanges or on aggregate, it may indicate that liquidity is increasing, decreasing, or shifting places. Certainly something worth knowing.
- absolute vs. relative distribution: we have shown here relative distributions, i.e. no mention is made of the absolute size available in the respective order books. Also, we have looked at one asset only, BTC. Well, there’s only so much we can do here. Bear with us, we have much more to say on those subjects!!
Welcome to the wonderful world of liquidity analysis!