
How we built a quantitative indicator on market integration
There is a lot of talk about arbitrage in the world of digital assets. Myth or reality?
We at SUN ZU Lab wanted to provide the necessary tools to examine this question and provide reliable answers. Therefore we designed a quantitative indicator to detect macro arbitrage opportunities when markets fall out of synchronization. Our goal was to produce an indicator that captures the existence and broad magnitude of price discrepancies between markets on the same asset. A secondary objective was to determine to what extend those discrepancies appear and disappear based on market behavior (e.g. volatility) or geography (e.g. region).
To that effect, we built our indicator which we denote “arbitrage index” (AI) calculated as follows. Let amp(1’, t) be the 1-minute volume-weighted average price (VWAP) amplitude:
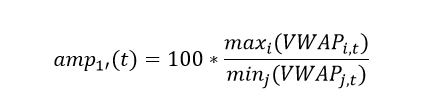
i and j are indices on markets. VWAP is the volume-weighted average price on a given market at time t. In plain English, amp(1’,t) is the ratio of the highest VWAP to the lowest VWAP across all included exchanges for a given 1’ interval. The arbitrage index (AI) is the hourly average of all amp(1’,t).
This indicator fulfills our need:
- In the absence of price discrepancies between two markets, their respective VWAP over a given period of time are very close if not equal. In the above formulation, this translates into: amp(1’) = 1 at any point in time. This idea can be easily generalized: adding more markets trading at the same price will keep amp(1’) close to 1.
- By construction amp(1’) > 1, and so is the index AI. A deviation in price will result in a deviation of AI from 1.
- Because AI is an average over period of 1 hour, short-lived deviations tend to be averaged out. For AI to differ significantly from 1, there needs to be significant variations for short periods, or smaller variations that last. The indicator is not meant to distinguish between the two situations, but it clearly shows when prices are not aligned.
- The index is only dependent on trade data, not order book data. This is helpful because order book data (also called level III) is quite difficult to obtain. Many exchanges offer periodic “snapshots” but intractable issues potentially arise when processing those snapshots, first and foremost the fact that they are not synchronized.
- Comparing market integration across space is relatively simple: markets are grouped by region, and by construction, all min/max ratios are limited to intra-group comparison.
Market professionals will find that this indicator is too “macro” and not precise enough. Indeed, it is true that this methodology leads to only a gross estimation of real-life price discrepancies. A rigorous analysis based on tick-by-tick analysis would yield much more robust estimates, as they are seen in real time by active traders (by the way we do agree and will move in that direction!). Nevertheless our indicator does a fair job at showing relative market integration, both in space and in time, which is exactly its objective.
For the purpose of practical calculations, markets have been grouped in three regions:

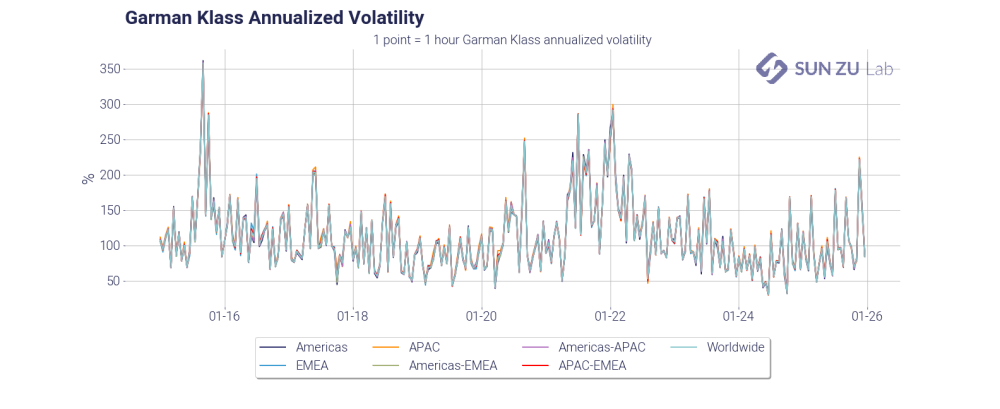
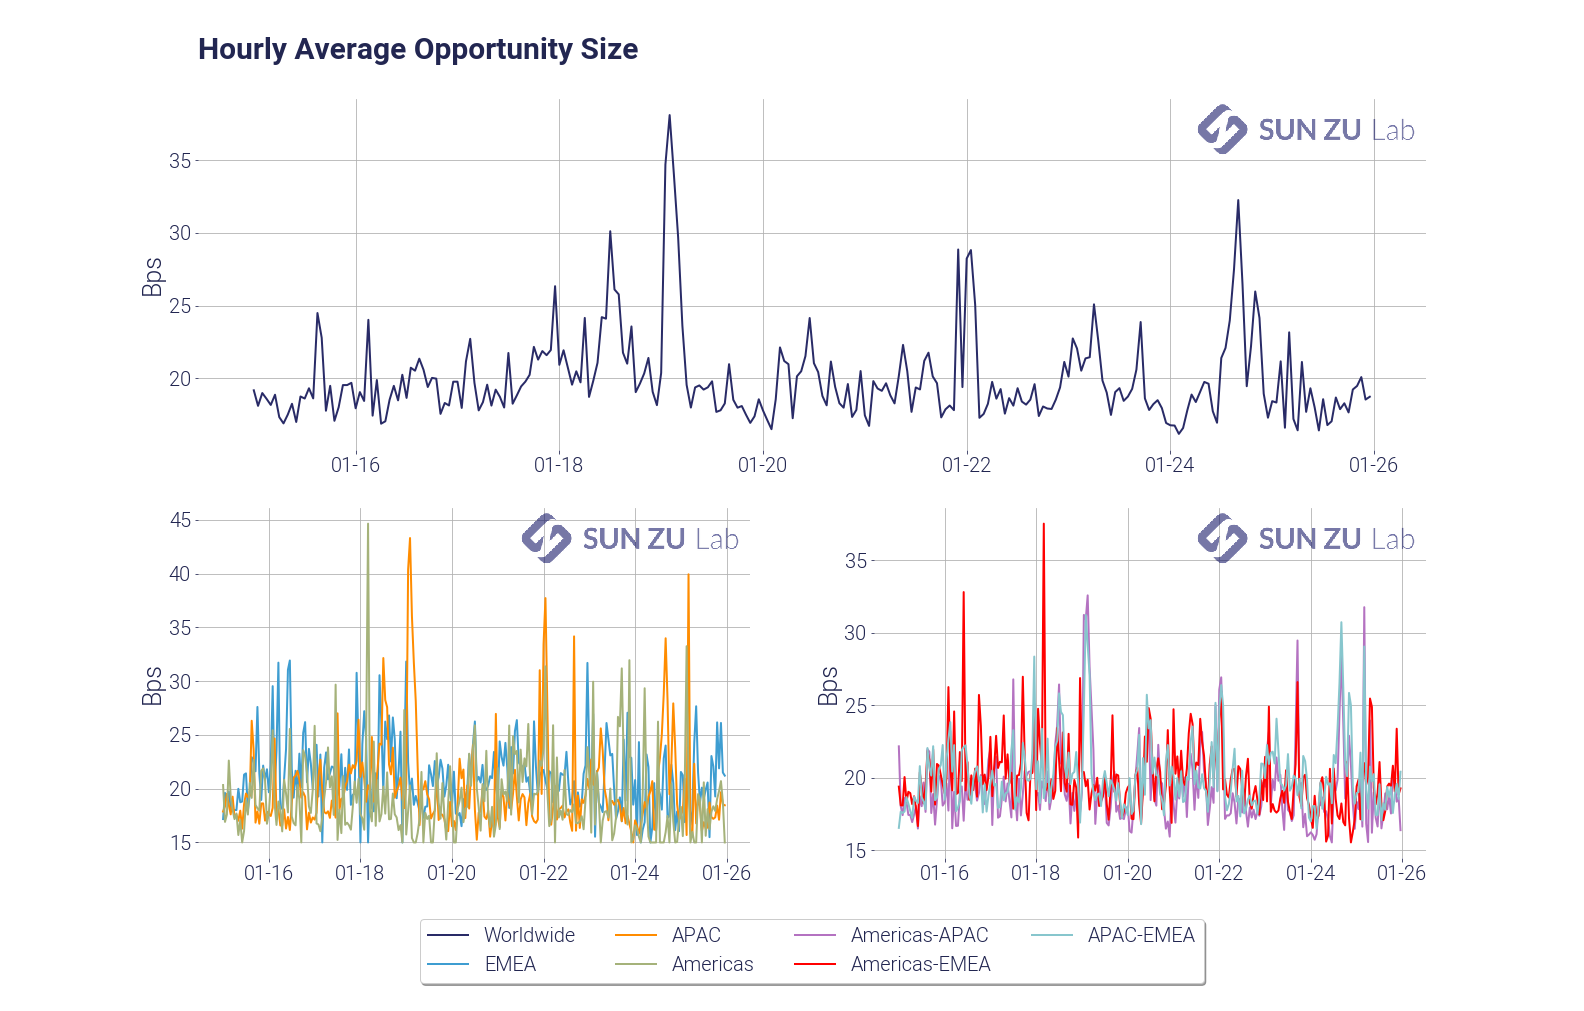
The chart below presents the index globally (top), by region (bottom left), and inter-region (bottom right):

It appears the index differs significantly from 1 during the period, which clearly shows that market are far from being closely integrated.
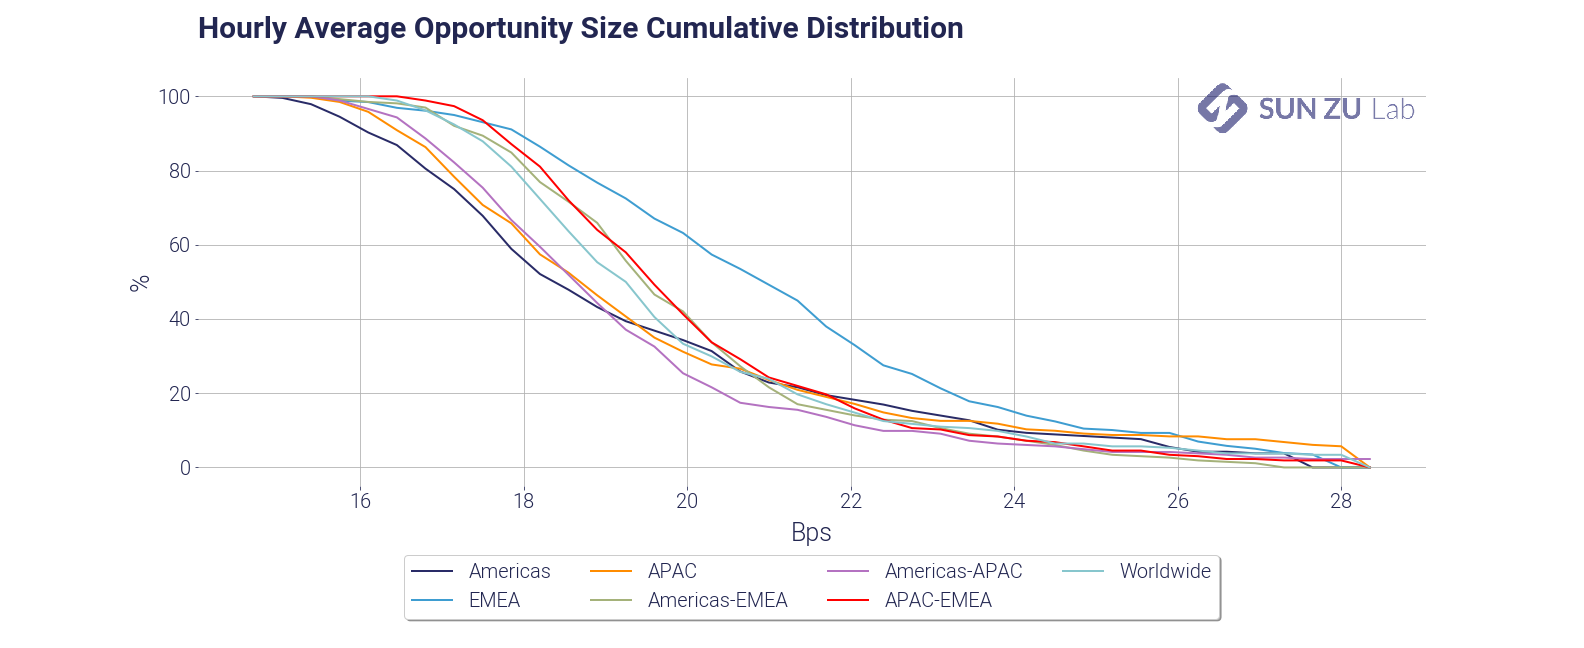
The following charts show volatility, and the cross-reference between the index and volatility:
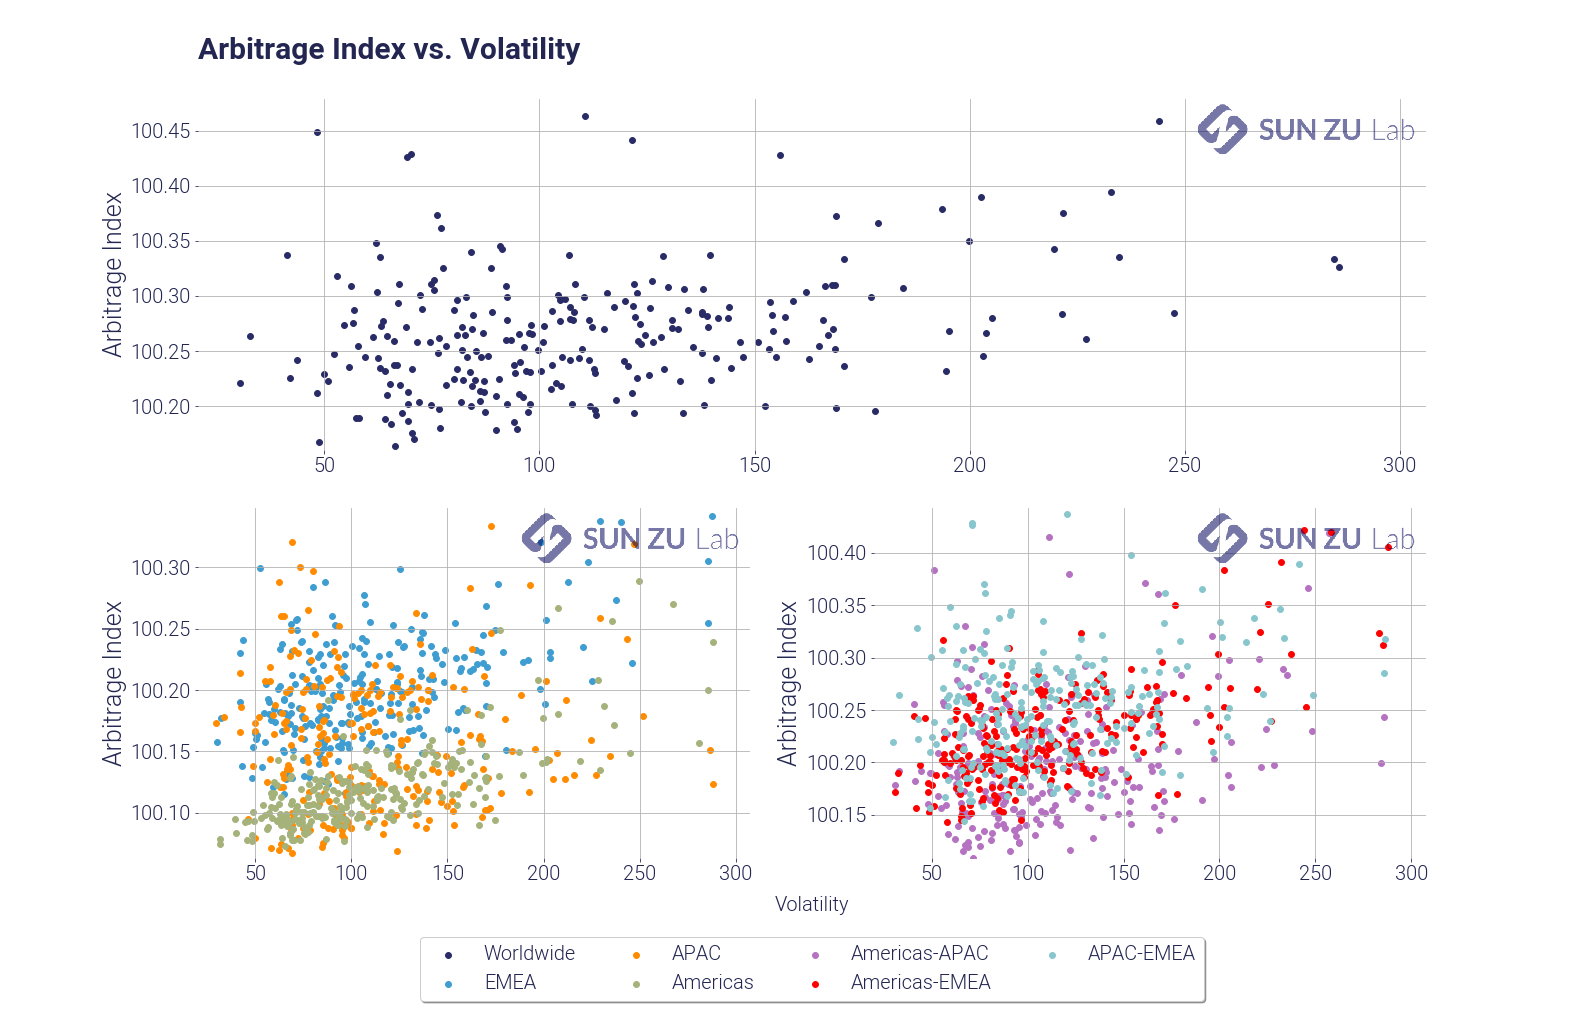
Even though the relationship between the two doesn’t appear to be straightforward, there is a strong sense that the indicator does indeed increase for volatile prices. At the same time it is fair to conclude that volatility is not the only factor responsible for prices being out of sync.
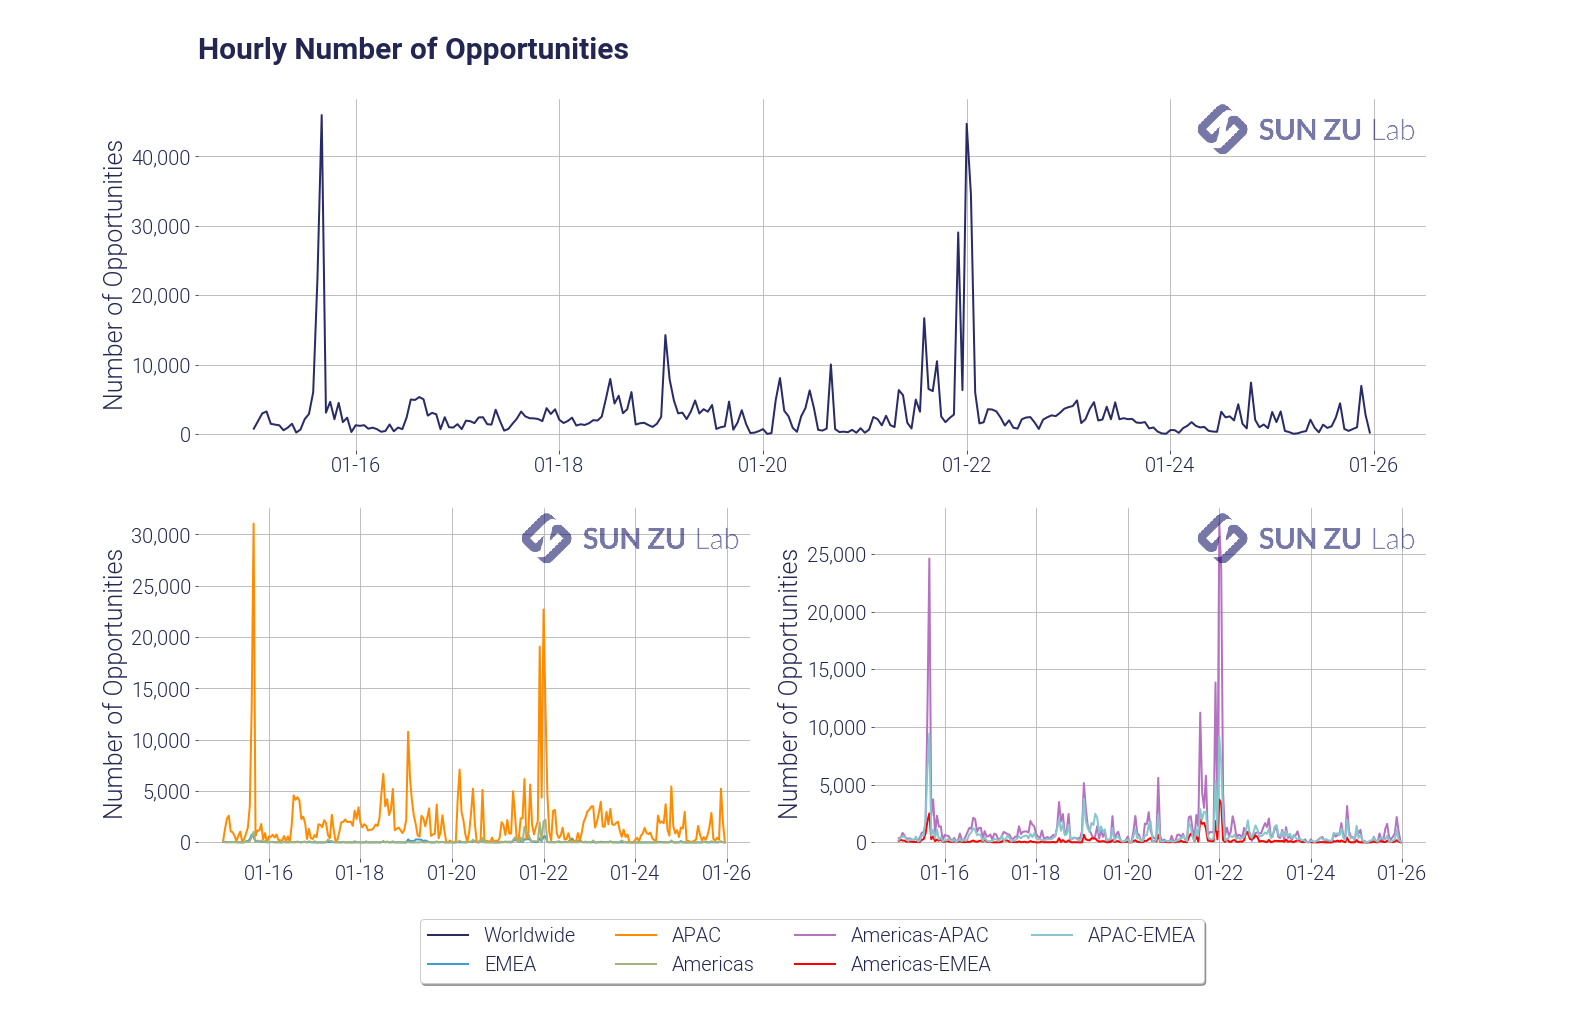
We go one step further in our analysis and produce a “theoretical P&L” based on opportunities we detect. What is an opportunity? As it happens crypto exchanges produce a useful indicator for each trade: the side of the trade (bid or ask). Based on this indicator it becomes possible to isolate price discrepancies that could be seen as an arbitrage opportunity by participants. Here is our methodology:
- for each incoming trade, we know the price, quantity, side and timestamp. We look back at each transaction that preceded across all exchanges in the same region, within a 500 ms window. This last parameter has been fixed arbitrarily, but is meant to capture the “typical” time window needed for traders to identify and capture opportunities. Our liquidity report shows for example the mean time between trades for different exchanges, and it is typically between 500ms and 2s. For a trader to lock an arbitrage there would have to be at least two orders sent at the same time, immediately after the price anomaly is detected. We hypothesize that the latency to post those, combined with the latency for detection, is at most 500 ms. In some cases a market maker may already be present in the order book on one side, in which case there would only be a single order to send. We are very mindful of our choice for the time window, and further research may lead us to refine our model.
- If we find in the previous 500 ms window a trade with an opposite side and better price, we consider an opportunity appeared. For example with a transaction of 1 BTC at $10,000 (a very hypothetical price these days) registered on the offer of one exchange, we scan the preceding 500 ms for transactions on the bid, at a price higher than $10,000. The existence, within this time frame, of those two transactions suggest that at some point the bid of one exchange was strictly above the ask of another, thereby creating an opportunity that would have been seen by all and possibly captured.
- When two transactions are paired, we consider the minimum size of the two to be consummated and not available for subsequent pairing. This way we make sure that volume for each transaction cannot be included in two distinct opportunities. We then increment several counters: the number of opportunities, the theoretical P&L, and the arbitrable quantity.
- We also filter out all opportunities below a minimum threshold (15 bps in the charts below) to keep the noise level under control, and accounts for wide differences in execution circomstances. For example a market maker physically located near an exchange will probably enjoy fairly low trading costs and latency. It is naturally impossible to account for the variety of situations, therefore excluding small to very small discrepancies is a “brute force” fix. This trimming significantly decreases the number of anomalies detected.
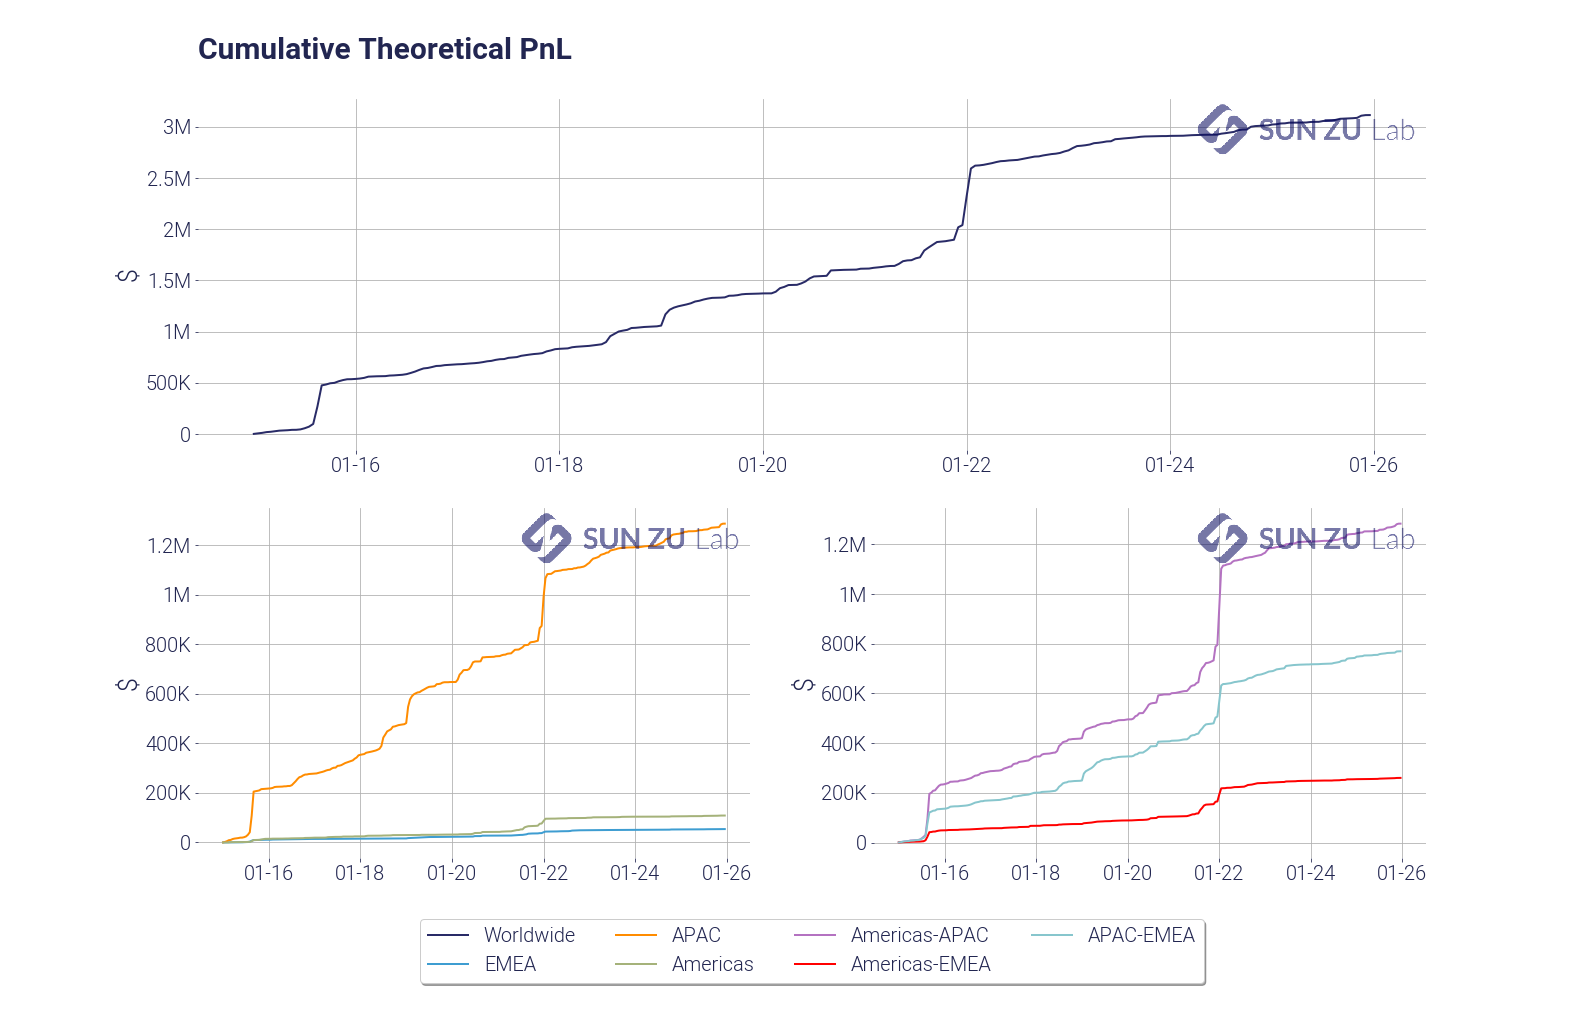
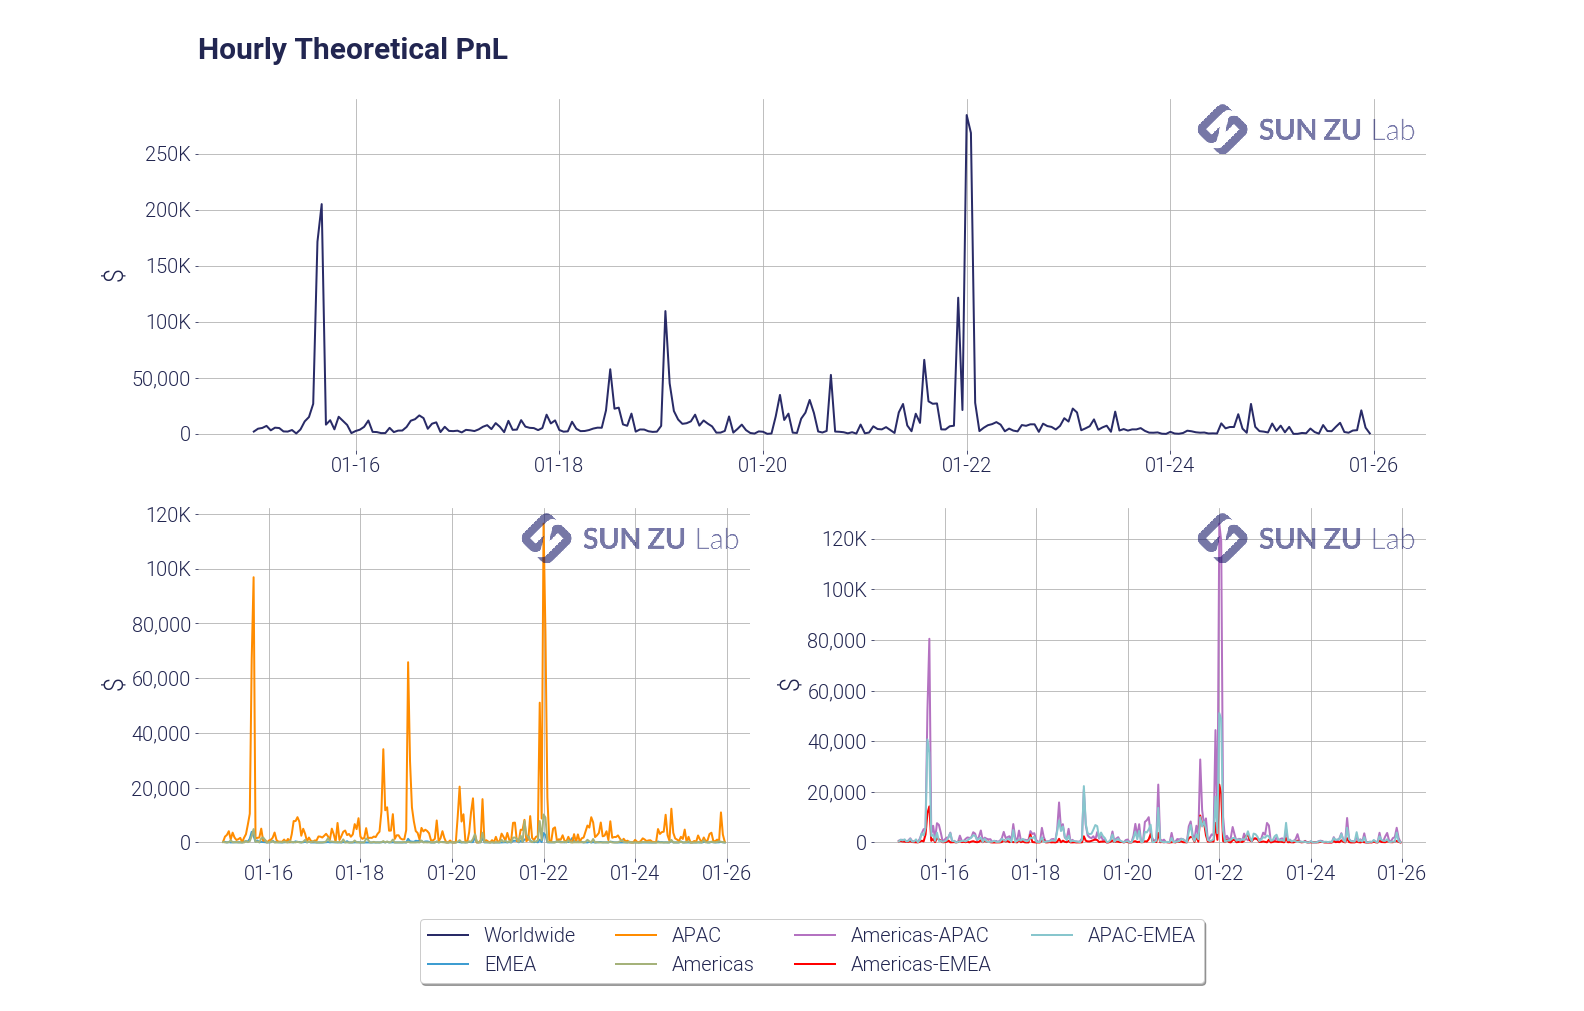
This methodology leads to the following results:
And subsequently to the following theoretical P&L:
Overall, we believe our AI indicator is a reliable and significant measure of market integration, and we will produce a bi-monthly report incorporating the above results (and more!) for BTC as well as other digital assets. Investors seriously curious about cryptocurrencies and digital assets may find in this a way to monitor market efficiency as it evolves through time and across trading venues.
To register for a 30-day free trial on our research consult our web site or contact us. And by the way feedback and comments are always welcome!