Indexing has been a popular strategy on traditional markets, indeed recent history shows index funds and ETFs have received massive inflows and registered a growth in assets superior to actively managed funds.
Thus it is no surprise that indexing is starting to emerge on digital assets. It is a way for investors to diversify their exposure away from the most heavily traded assets while keeping a rigorous methodology to avoid arbitrary decisions. Trakx is a leading provider of such indexing solutions.
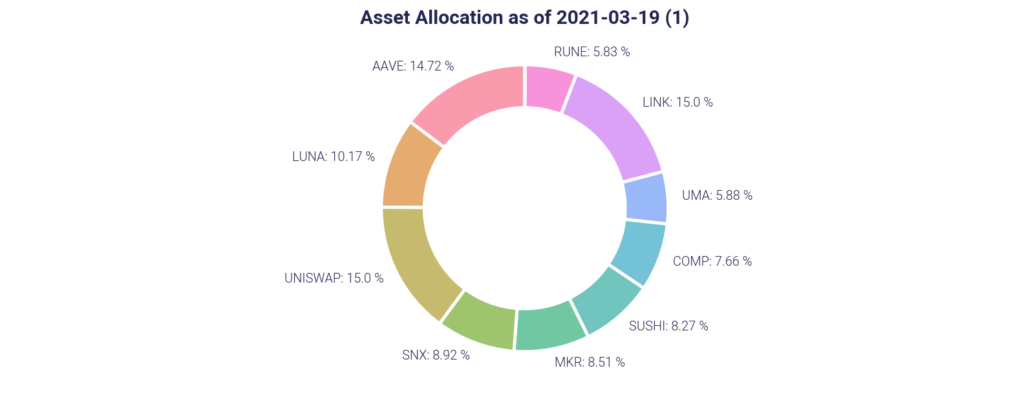
However, investing under an indexing strategy doesn’t necessarily mean more liquidity. Indeed an index is often nothing more than the sum of its parts. Assessing index liquidity means therefore looking in-depth at the underlying basket. This is our specialty at SUN ZU Lab, and the purpose of this article is to introduce our methodology in the context of one of Trakx’s indices, the TOP 10 DEFI Index with the following composition:
Our intention was to establish the fundamental liquidity profile of the index, enabling investors to tailor their execution strategy to the reality of the marketplace.
What are the fundamental characteristics an investor will want to know?
If you were to invest in any kind of security your first question would be to assess how much capacity is available without causing adverse price movements. Is that capacity compatible with your allocation? If not, you will not be able to build the exposure you want.
Investing in an index means buying the underlying basket and tracking changes through time. Those changes are governed by written documentation issued by the index sponsor. For example, if you were to invest $100,000 in an index with 4 equally weighted components, you would have to invest $25,000 in each of them. Each component has its own characteristics. Buying $25,000 in one of them may require digging significantly into the order book, while buying another may simply require hitting the first offer on the market. Furthermore, an optimized execution strategy needs to factor in the ability of an intermediary, for example, a specialized broker, to provide better prices than might otherwise be available. This would be the case for instance if the broker was able to find an aggressive seller when you placed your order.
We submit that there are really two principal measures of liquidity to help investors with their allocation on a given asset (or indeed index): capacity and slippage.
The notion of capacity answers the following question: how much volume is needed to absorb the exposure that I want to take (or unwind)? The same question can also be formulated differently: under reasonable constraints on my participation in the market, what is the addressable liquidity?
Slippage analysis is focused on the measure of price deterioration vs. execution size and is trying to answer the following question: what is the price deterioration associated with the exposure I want (i.e. how much do I have to pay to find adequate liquidity for my exposure)?
Capacity
Our liquidity analysis for Traxk Top 10 DEFI index looks at those measures (and several more incidentally). For example, the following chart shows the capacity for a 20% participation at a point in time (here daily for the second half of March):
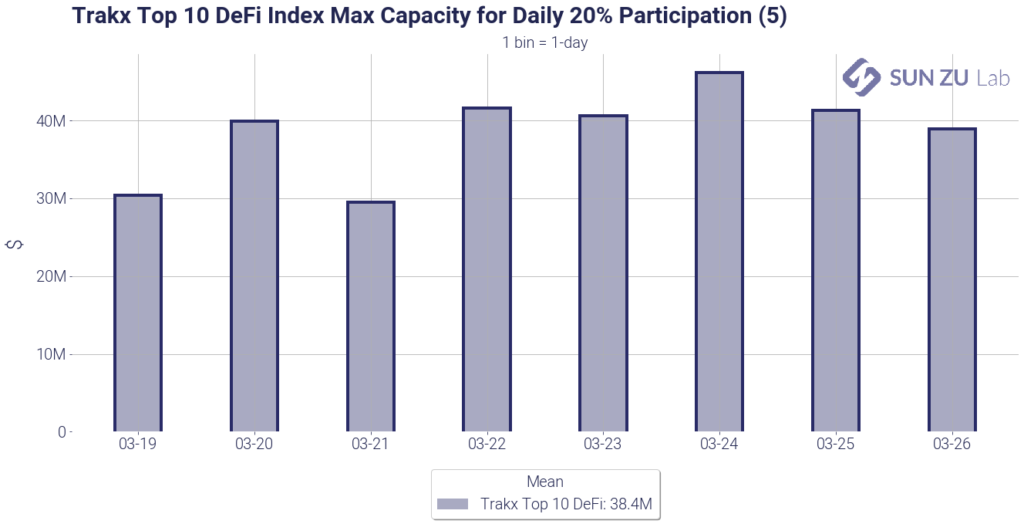
For each asset, the maximum addressable size is calculated under a constraint of 20% participation in the market. From this figure, a total capacity for the index is inferred based on individual asset weights. For instance, the figure of $40M on March 23rd reads as follows: buying $40M of the index on that day is the maximum to execute less than 20% of the day’s volume on each index component. As can be seen from the chart, the figure is fairly constant throughout the period, and the average is displayed in the legend: $38.4M.
Naturally looking at daily volumes may be inadequate for smaller exposures, and intraday figures would be useful. We do provide those as well, in the form of an hourly capacity:
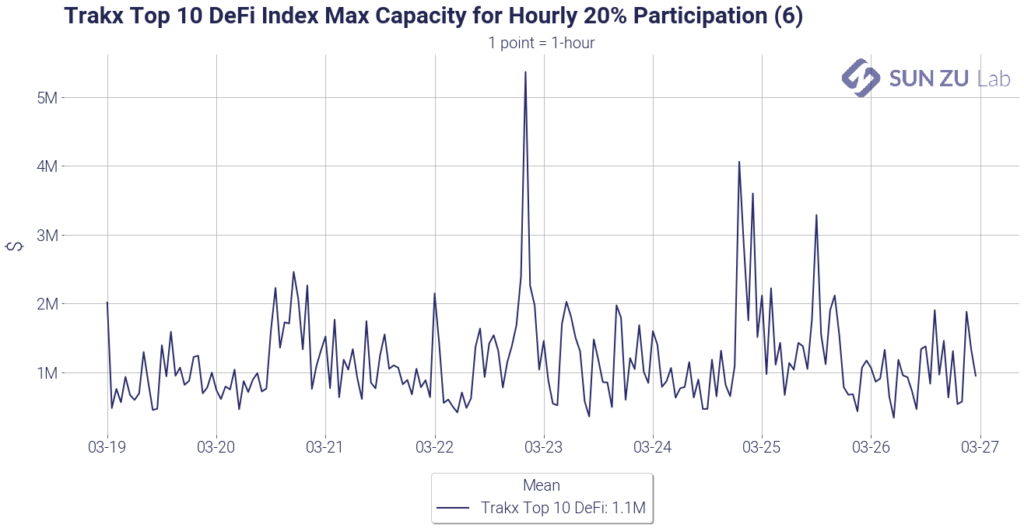
The calculation is identical to the daily one, except the time interval is set to 1 hour. The chart suggests that in this timeframe, a 20% cap in participation will result in a $1M addressable liquidity. This figure may seem small, but it shouldn’t be interpreted for more than what it is: a passive observation of market behavior. If a market participant was actually entering the market at one point to build his exposure, he would most certainly attract more liquidity above and beyond the one passively recorded here.
To complete the participation picture, we thought it would be useful to know which one of the index components is responsible for constraining the overall liquidity. If all components had similar liquidity at all times, this question wouldn’t be relevant, but naturally, this is not the case. Individual variations mean that one asset may be the “limiting factor” at one point in time but not before or later. To provide an intelligible picture we built the following chart:
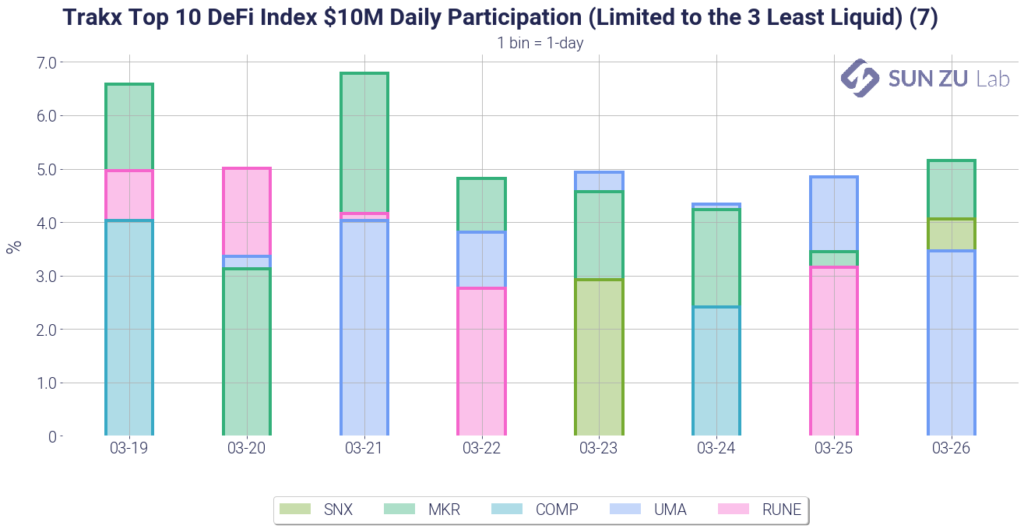
It shows over the considered timeframe the individual participations for the least liquid index components, for a $10M size. We limited the number of assets to 3 daily to avoid information overload. For example, on March 21st, a $10M order would have resulted in a 7% participation for MKR, 4% for RUNE, and 4% also for UMA. All other tokens had lower participation on that day (and hence are not shown here).
The picture gives the following insights:
- There is no single “limiting factor”: among the 10 tokens in the index, 5 of them appear in the least 3 liquid at one point or another. That is good news, it indicates that there is no “single point of failure” to transact the index.
- There are however tokens that appear more often: MKR and UMA are present almost every day. Particular attention should be dedicated to those two names when it comes to execution strategies.
- For index sponsorship at Trakx, those statistics may indicate the need for rebalancing the index if MKR or UMA (or any other token) exhibits insufficient liquidity. Along the same lines, investors may want to search the market for liquidity in MKR and UMA as a prerequisite to investing in the index.
Slippage
The other quantitative measure of liquidity is slippage. It is a measure of price deterioration when actively buying or selling a financial instrument. The idea is quite simple: if the mid-price of an asset is $100 when you start buying, and if your average price is $100.3, then slippage for this particular execution is 0.3%.
Slippage is a very “local” measure, it is extremely dependent on the execution strategy deployed, and on the circumstances of the moment. The same order may face very different conditions depending on when and where it is executed. Do you access liquidity on one single venue, on several, and if so which ones? Do you aggressively consume liquidity available in the order book or patiently place your orders and wait for matching orders?
To address those questions, we present the following chart, showing an intraday $500K market impact for the index:
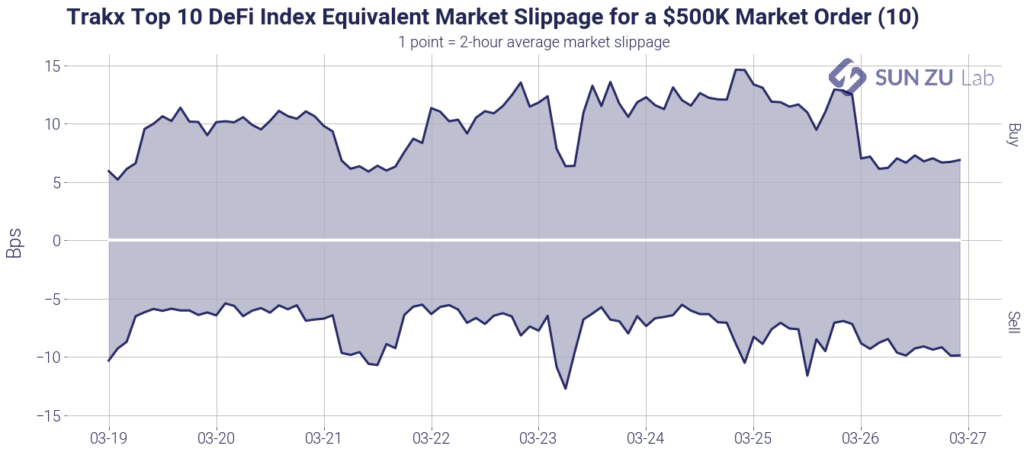
It shows the expected price deterioration for a $500K order over a 2-hour execution window, on both sides of the order book. As can be seen, the impact here is quite reasonable at around 10 bps. As was said before, this figure shouldn’t be taken for more than what it is: if an investor was to enter the market, there is no way of telling how much more liquidity he would find. Along the same lines, for an order larger than $500K, the estimated impact cannot be considered linear (i.e. $1M order would not necessarily create a 20 bps impact).
Like before we wonder also about the intraday “limiting factor”: which token(s) is(are) responsible for this impact? We answer this question along two distinct axes. First, we look at the 3 tokens with the largest capitalization in the index to get a sense of slippage on them. Second, we look at the 3 least liquid. The following charts show the results:
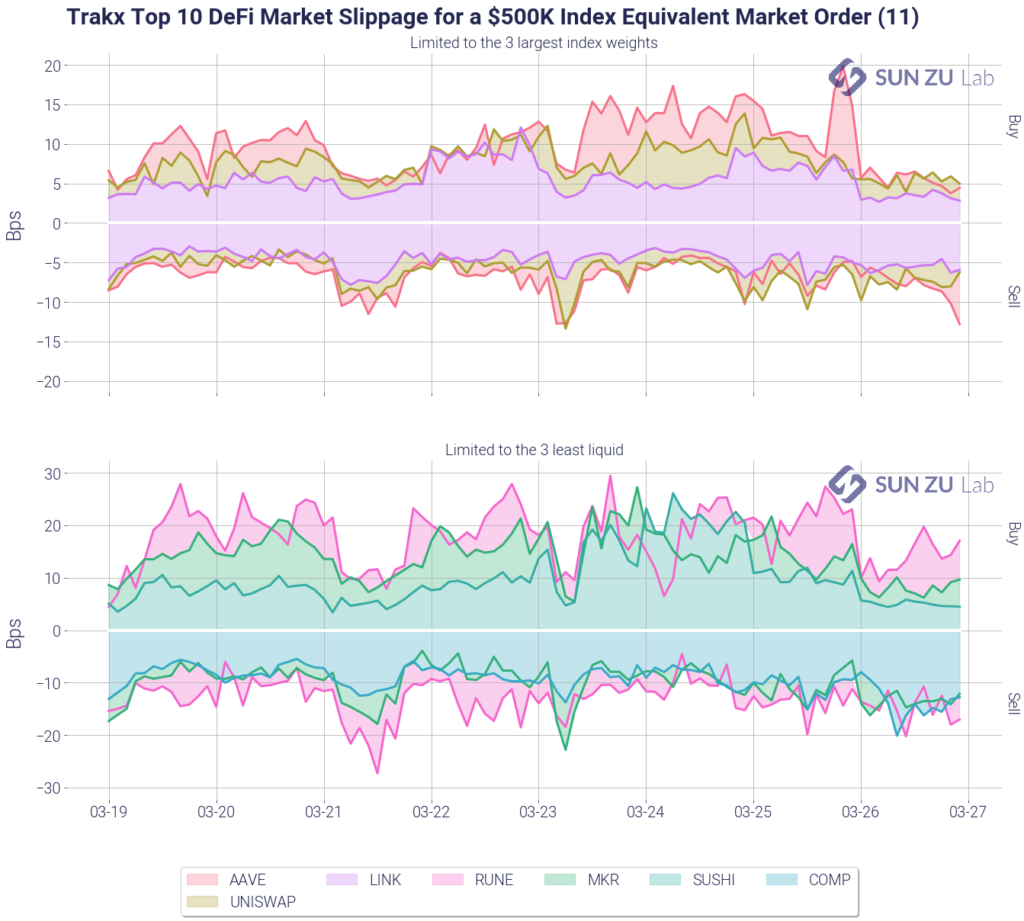
The largest cap tokens are indeed not limiting factors here, if anything the impact on those (5~10 bps) is smaller than on the index as a whole. The 3 least liquid are indeed responsible for the impact of the index, at 10~20bps each.
Note by the way that the least liquid according to the impact metric (RUNE, MKR, COMP) are similar to those considered least liquid when looking at trading volume (RUNE, MKR, COMP).
Conclusion
What actionable conclusion is an investor to draw from this analysis? Well, firstly he or she would be able to quantify the current addressable exposure in the marketplace. This is quite important information, as it enables sizing up execution. Secondly, he or she can extract a first-order estimate of market impact for the considered index. This is also a critical factor, if only because it is helpful when benchmarking providers of execution services, whatever the form (algo, block, direct-market access, etc.) Finally, we believe our research can help Trakx refine its indexing methodology, to reflect not only capitalization but also liquidity, another key characteristic to promote truly investable indices.
Because digital assets are still in their infancy, those metrics should be monitored closely as they evolve almost daily. To enable investors to keep close contact with the market, SUN ZU produces an impact analysis at least twice monthly, and on-demand if necessary.