
Background
Bitcoin and digital assets in general have been presented by some as credible alternatives to institutional finance as we know it today, with its strengths and especially its weaknesses — widely exposed and documented with the 2008 crisis. The idea of a mechanized trusted third party has a certain appeal. Removing human arbitrariness and intermediaries in the management of money would make it possible to get rid of what is perceived as cumbersome state control and to guard against the stranglehold of the financial industry, which is accused of taking a large share of profits and caring far too little about consequences. Gone are the days of lax inflationary policies steered by a central bank subservient to political power. Not to mention the possibility of keeping one’s savings right under the nose of bankers and tax officials.
There is much to be said for a world in which dehumanized algorithms, complete anonymity and decentralized governance have become the norm, a world that is unlikely to deliver on the promises its proponents put forth, both in terms of efficiency and equity — not to mention questionable transparency, which is high on the list of criticisms from institutions today. But some proposals are worthy of attention and, at the very least, of consideration. One of them is the following: are digital assets likely to offer true storage of value, independent and uncorrelated to traditionally available assets (shares, bonds, gold, etc.)? The example of countries with failing institutions is often cited, such as Venezuela or Nigeria. Bitcoin would be a way to hedge against immediate monetary turbulence, delirious black market exchange rates etc. With the coronavirus crisis, this question extends to developed economies: would it be in the interest of an individual or institutional investor to transfer part of his savings to bitcoin in anticipation of a collapse of traditional assets or even the financial system as a whole?
Let’s eliminate immediately the hypothesis of the collapse of the system: if such a catastrophe were to occur, the consequences would be sufficiently devastating to take with them the very existence of a “safe haven”, a compartment protected from the ambient deflagration. Instead, we will try to answer the question of the allocation between digital currencies and traditional financial assets.
Examining this idea requires some work, which we will carry out in a very basic way. The question can be rephrased as follows: “if I had chosen to invest part of my assets in certain digital assets, would I have done better than traditional markets? ». We consider this problem through the examination of three elements: the performance of digital assets, their volatility and their liquidity.
Performance is used to determine whether or not an investor would have avoided a decline or even benefited from a rise if he had “pivoted” to a digital asset. Volatility gives an idea of the carry of a position, i.e. its variation over time: is it really a smooth ride? Liquidity is a slightly more technical notion: when the market panics, is it still possible to carry out transactions or, on the contrary, does everyone run away?
A word on the notion of “safe haven”. This concept captures the idea that there are assets — financial or otherwise — that provide safety in the event of financial turbulence. The perception of security can be linked to objective or subjective criteria. When investors bought US and German debt in the sovereign crisis of 2012–2013, the perception of security was linked to an objective factor, the economic resilience of those economies and the very high probability that governments would be able to meet their commitments. Conversely, the status of gold as a safe haven has no basis in reality today. When world currencies were pegged to gold in the Bretton Woods world, gold was the ultimate security since it was the assurance of being able to buy any currency at a fixed price. In the modern world, where exchange rates are floating, possession of gold does not provide any real safety. We are in the realm of self-fulfilling prophecies. Everybody thinks that gold resists better when the markets fall, so investors buy it as soon as tensions appear, and bingo we see a posteriori that the predictions have proved to be correct. Another important point is that the use of safe haven assets is limited in time. Nobody takes a position on gold to protect a portfolio over 15 years. Anyone who is significantly invested in gold for 15 years does so to diversify their risk in an allocation strategy, not to protect themselves from volatile periods. A safe haven plays a role episodically, mainly when the markets are nervous. It is therefore at this time that one must look closely, and this is why the recent crisis offers a particularly relevant point of observation.
A quick methodological note: the S&P 500 is modelled by its most liquid exchange-traded fund (ETF), known as the Spider (ticker SPY, $257 billion in assets as of 4/24/20) Gold is modelled by the sum of the two largest physical ETFs (tickers GLD and IAU, $80 billion in assets). US government bonds are modelled by the iShares 7Y-10Y ETF (ticker IEF, “only” $21.5 billion in assets). The BTC/USD and ETH/USD data are from coinmarketcap.com, volumes were divided by 10 to account for the numerous and documented manipulations of various exchanges on their data. The factor 10 is arbitrary but regularly appears as a working hypothesis in studies on the issue (but in fact the absolute value of the volume is of little importance here). The prices are the closing prices, and of course all execution issues are neglected. Access considerations are also neglected: the products used here are easy to access, anyone can open a securities account with an online broker within a few days. Access to digital assets is not yet so democratized. All this is therefore very simplified.
Performance
The performance we are interested in is the one surrounding the recent crisis. An investor who has been carrying bitcoin or ether for a long time is doing so for reasons that are not our concern here. Here is the relative performance of the 5 assets between 01/23/20 and 4/22/20:
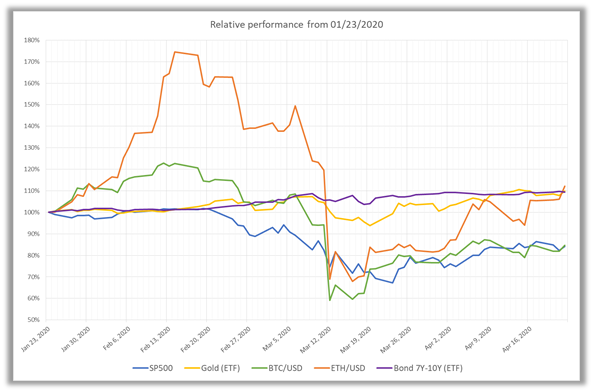
The charts speak for themselves: the crisis reached its climax on March 12th, after the US President announced, quite unexpectedly and without any consultation, the closure of US borders. All assets drop sharply, except bonds, which have always been considered safe among the safest. Surprisingly, gold is also falling significantly. It appears that bitcoin or ether would not really have been an insurance policy. The BTC holds better over the few days before the crash, but drops lower immediately afterwards.
Another way to answer the same question is to ask what was the “safety premium” for investors who made the right choice? Prior to March 12th, investors were given a free hand to choose the best investment if they sensed upcoming turbulence. This behavior, called “flight to quality”, is widespread. Before mid-March the pandemic was beginning to show its effects in China, nervousness about the impact and spread of the disease was beginning to show. A prudent investor could have chosen to transfer some of his positions to assets considered safer, such as gold or US sovereign bonds. The outcome would have proved him right… The following graph shows the premium he would have captured:
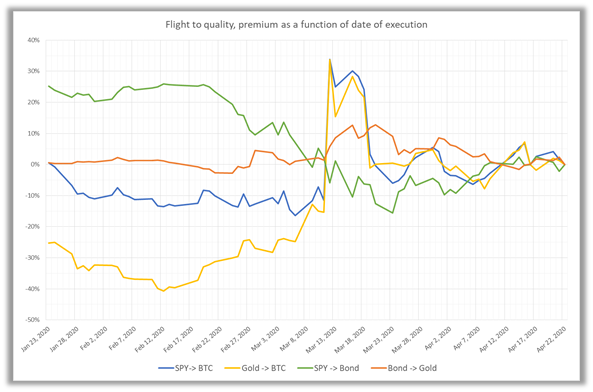
Precisely, the green curve reads as follows: an investor who would have transferred his position on 01/23/20 from the S&P 500 to US bonds would have captured a 25% gain between 01/23/20 and 04/22/20 (compared to a situation where he would have remained invested in the original support). In concrete terms, he would have avoided the massive decline around March 12th. If he had taken this decision later, at the end of February or the beginning of March, he would still have gained 10%. The graphs show the exact premium captured for having changed support, depending on the date the change takes place.
It appears that the choice to pivot from S&P 500 towards BTC (blue curve) only pays off on March 12th, when the BTC loses 37%. Pivoting from gold to the BTC would have been even worse off (yellow curve).
Note that after the crash, the decision to stay invested in the original support or to pivot is of little importance: from about March 26/27th, the curves are rather undifferentiated. Moreover, the bond > gold pivot (orange curve) turns out to be winning at almost any time…
Volatility
To examine volatility, we could use the financial version, i.e. the annualized standard deviation. But for a change we will use a more intuitive measure, the intra-day variation. The following graph shows the 90-day moving average of the daily high-low amplitudes of the 5 assets:
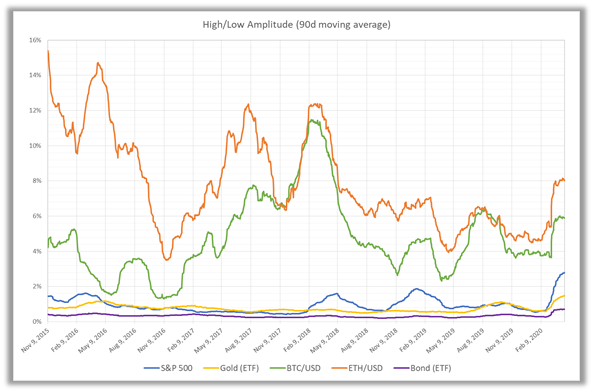
NB: the starting date is arbitrary, it was chosen to visualize about 5 years of data.
This is an intuitive rather than a financial measure of price variability, which can be understood as follows: since May 2018, on a “normal” day, the BTC has varied on average by 4% to 8% between its highest and lowest price. In contrast, the S&P 500, gold and bonds only vary between 1% and 2% (or even less). In March, we see a significant increase in these figures, which corresponds to higher intra-day volatility, i.e. the effect we want to measure.
Indeed, carrying a BTC or ETH position is not a smoot ride compared to other asset classes: the amplitude of movements is 4 to 5 times greater. Incidentally, dealing in BTC requires careful monitoring compared to traditional assets that have the good taste of moving less quickly and whose markets are closed several hours a day.
Liquidity
Finally, let’s look at liquidity, characterized by daily volumes. This is an ex post measure of liquidity, precisely that which has been expressed in the form of transactions. We could also look at an a priori measure, the liquidity available before execution in the order books of exchanges, but that is a more complex task…for another time. The graphs below show average trading volumes (90-day moving average) over a period of about 5 years, with 1-month volatility as the second axis:
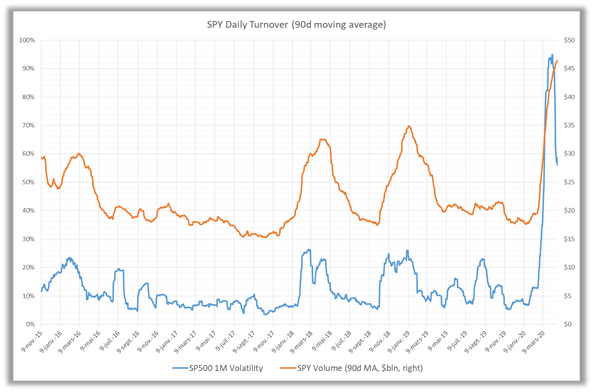
The S&P 500 ETF is one of the most liquid instruments in the world, with $20 to $30 billion traded daily. The causal relationship between volatility and volume is immediately visible. Same presentation for gold:
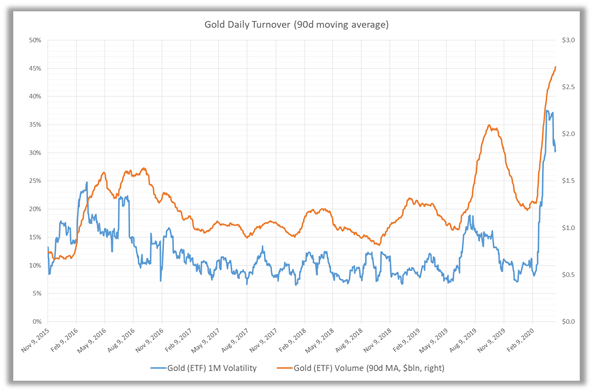
The ETFs under consideration only trade around $1 billion a day, but the causal relationship is still perfectly visible. NB: the volatility seems much more uneven than that of the S&P 500, but this is an optical effect related to the smaller scale.
Here is finally the same graph for the BTC:
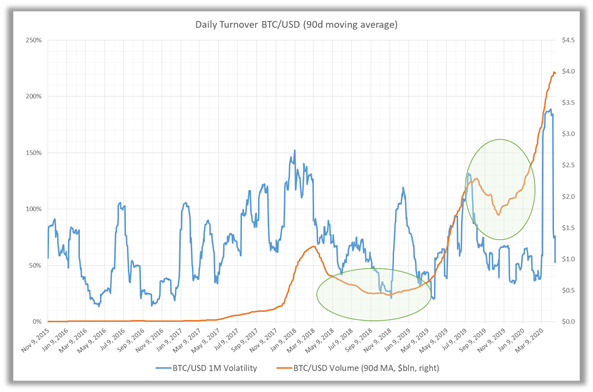
If we had to (re)confirm the much more volatile behavior of the BTC, here it is: volatility episodes are frequent, acute and independent of those of traditional markets. But this graph raises many questions.
Compared to previous ones, it immediately appears that volatility/volume causality breaks down. Some peaks in volatility are not accompanied by any increase in volume, and conversely the volume seems to grow by itself…
The two areas circled on the graph are anomalies, presumably explicable by the fact that the officially announced volumes are vastly overestimated and that the magnitude of the “ghost” volumes varies over time. Both the S&P 500 and gold (and the bond ETF, not included here) show a fairly stable “structural” liquidity: when volatility eases, the average volume falls back to a floor. The fact that it falls very sharply on BTC between May 2018 and March 2019 suggests that the “true” floor is much lower. Similarly, in the second half of 2019, volumes return to average levels for the S&P 500 and gold. Nothing comparable for BTC (or ether), growth is exponential. It is not justified by any measure of volatility, nor by any other market event or media coverage.
Conclusion
To the question “Is BTC a credible alternative to the volatility of traditional markets?” it is fairly easy to offer a negative for the recent crisis. It is certainly an isolated point — but absolutely significant in view of the magnitude of the crisis. There is no doubt that gold and sovereign bonds are still the “safe havens” they have long been. On the other hand, the liquidity of bitcoin (and ether) is still problematic, and does not exhibit an explainable pattern in view of the proven behavior of the investment community as expressed every day elsewhere.