By Chadi El Adnani, Crypto Research Analyst @SUN ZU Lab
July 2022

We revisit in this article a question studied by Sun Zu Lab in 2020 during the financial crisis caused by the Covid-19 pandemic: did bitcoin resist the market downturn better than other assets in 2022, and would it have been strategically interesting for investors to shift some of their positions to bitcoin before the downturn? the answer to these questions is still negative, as it was the case in 2020. We study in this analysis the behavior of various assets over the year 2022, specifically bitcoin, ether, equity markets (S&P 500), bond markets (US interest rates) and gold.
This result does not constitute an absolute answer to the intrinsic value of digital assets, but rather provides insights into a specific situation.
Economic context
2022 has been marked so far by the Russian invasion of Ukraine which, added to an economic context already weakened by the Covid-19 pandemic, has accentuated the slowdown of the world economy which could enter a long period of stagflation (low growth and high inflation). According to World Bank figures, global growth is expected to fall from 5.7% in 2021 to 2.9% in 2022, significantly lower than the 4.1% figure announced last January. We cannot help but notice the very visible parallel with the 1970s stagflation period. The comparison is striking: persistent supply disruptions that fuel inflation (Russian gas shortages, the effects of the prolonged severe lockdown in China on various value chains, etc.), coupled with the end of a long period of very accommodating monetary policy in major advanced economies: key interest rates close to 0%; Fed balance sheet in excess of $8.5 trillion (35% of US. GDP, an all-time record), etc. Added to this are projections of a slowdown in global growth and the fragility of emerging and developing countries in the face of the urging need to tighten monetary policies to curb inflation.
In this unique context, we wanted to put ourselves in the shoes of investors to understand whether it is in their best interest to move from one asset class to another, and especially whether cryptos represent an effective safe haven in times of crisis. We model the S&P 500 by its most liquid ETF: Spider (ticker SPY, NAV as of 06/17/22: $378 billion). Gold is modeled by its most liquid physical ETF (ticker GLD, $63 billion NAV). U.S. government bonds are modeled by the iShares 7Y-10Y ETF (ticker IEF, $18 billion NAV). Prices are closing prices and all execution issues are neglected. Access considerations are also neglected: the products used here are easy to access, anyone can open a securities account with an online broker or a crypto exchange in a few days. Data is extracted from Yahoo finance.
Finally, the « safe haven » concept reflects the idea that certain assets, financial or otherwise, provide a safe haven in the event of economic and financial turmoil. We often find in this category the US and German bonds, due to the almost absolute confidence in the strength of their economic fabric and their ability to always repay their debts. The Japanese Yen has often been considered a safe haven as well.
Performance
Without further ado, here is the relative performance of the 5 assets during 2022:
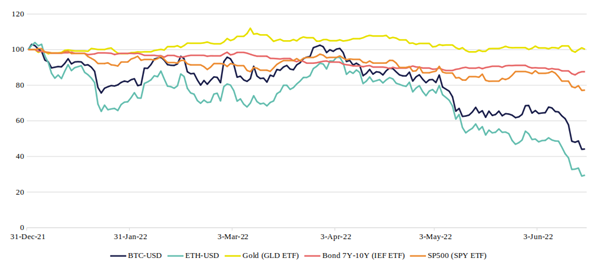
The numbers speak for themselves: only gold managed a stable performance in 2022 (0.2%), while BTC or ETH under-performed the bond and equity markets (-55.8% and -70.5% respectively).
Another way to answer the original question is to calculate the “flight to quality” percentage of investors who switched asset classes. Indeed, this type of behavior is extremely common; cautious investors forecasting the increase in interest rates and inflation at the beginning of the year might have chosen to move some of their positions to safer assets, such as gold, US sovereign bonds, or even Bitcoin? Let’s look at the results:
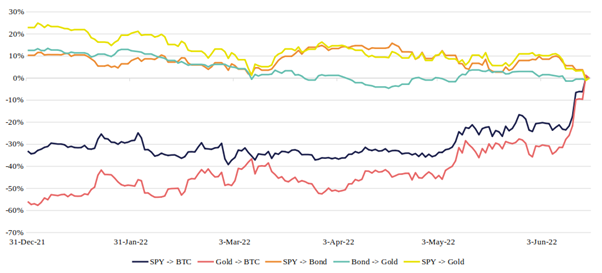
The red curve reads as follows: investors choosing to switch their position on 12/31/21 from gold to Bitcoin would have realized a loss of 56% between 12/31/21 and 6/17/22 (compared to a situation where they would have remained invested in gold). The graphs show exactly how much gain/loss was received for switching, depending on when the switch took place.
It appears that the choice to “pivot” from another asset to BTC has never paid off in 2022. Gold, on the other hand, has well played its role as a safe haven, providing positive gains at almost any time of the year on S&P > gold and bond > gold pivots.
Volatility
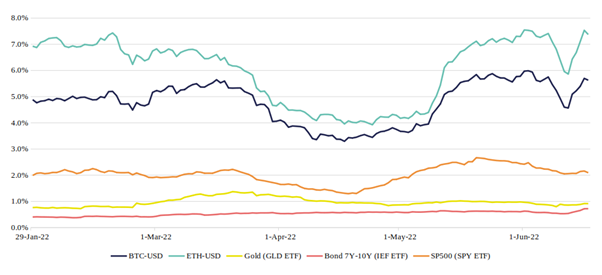
Rather than analyzing the assets’ volatility as defined by the classic financial formula, i.e. the annualized standard deviation of daily returns, let’s look at a more intuitive measure: the intra-day variation. We compute the 30-day moving average of daily amplitudes for the five assets.
The graph shows that over the year 2022, Bitcoin and Ether have varied on average between 3% and 8% from their highest to lowest price on a single day. In contrast, the S&P 500, gold and bonds only vary by 1% to 2.5% (or even less). Investors should keep in mind then that the amplitude of movements in crypto markets is 4 to 5 times greater than in traditional markets, which requires careful monitoring to deal with these risky assets.
Liquidity
Finally, let’s analyze liquidity as characterized by daily volumes. This is a post-trade measure of liquidity, i.e. the liquidity that has been achieved through transactions. We could also study a pre-trade measure: the liquidity available before execution in the exchanges’ order books , which is a little more complex to compute.
The graphs below show average trading volumes (30-day moving average) in 2022, with 1-month volatility (annualized standard deviation) as the second axis:
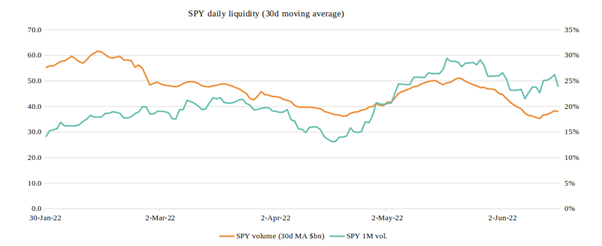
The S&P 500 ETF is one of the most liquid instruments in the world, with $30 to $60 billion traded every day. The causal relationship between volatility and volume is immediately apparent.
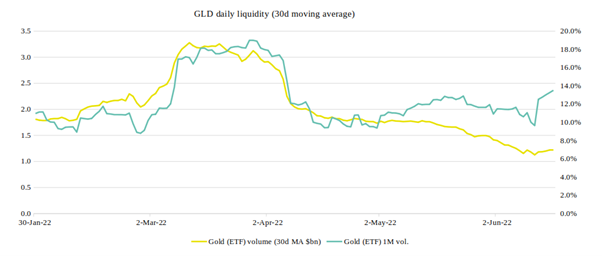
For the gold ETF GLD, we have daily trading volumes between $1 and $3.5 billion, but the causal relationship is still perfectly visible.
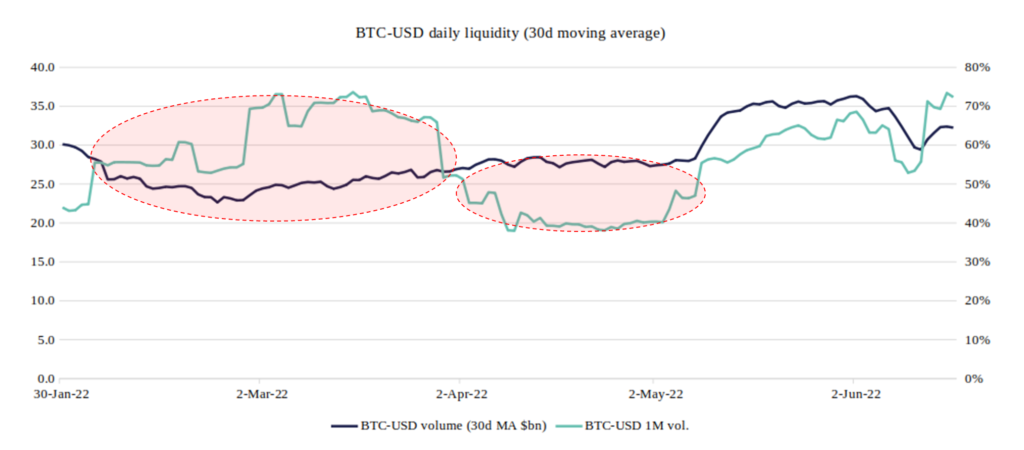
Regarding Bitcoin, we have first of all a confirmation of its very volatile character, with annualized volatility varying between 40% and 80%. This graph also raises discrepancies already made by Sun Zu Lab in 2020: it appears that the volatility/volume causality is still not respected, with peaks of volatility in February-March that are not accompanied by any increase in volume, and on the contrary periods like April when the volume seems to grow by itself!
The two circled areas on the chart are anomalies, likely due to the fact that the officially announced volumes are greatly overestimated and that the magnitude of phantom volumes varies over time. The S&P 500, gold and the bond ETF, not included here, show a rather stable “structural” liquidity: when the volatility peaks stop, the average volume goes back down to a base level.
Conclusion
The answer to the question “is BTC a credible alternative to the volatility of traditional markets?” is negative, again, over the year 2022. Unquestionably, gold and sovereign bonds are still the “safe haven” they have been for a long time. On the other hand, the liquidity of bitcoin (and ether) is still problematic; the volumes traded do not follow the same logic expressed historically by investors in the traditional markets.
Questions and comments can be addressed to c.eladnani@sunzulab.com or research@sunzulab.com
About SUN ZU Lab
SUN ZU Lab is a French Fintech that aims to become the leading independent provider of digital asset market quantitative analytics tools and services. Leveraging the founding team’s 70+ years of experience in international capital markets and trading technology, SUN ZU Lab provides crypto professionals with unprecedented liquidity analytics in the form of quant reports, dashboards, real-time augmented data feeds, and bespoke studies.