This website uses cookies so that we can provide you with the best user experience possible. Cookie information is stored in your browser and performs functions such as recognising you when you return to our website and helping our team to understand which sections of the website you find most interesting and useful.
SUN ZU Lab & OKX: Our first Exchange Liquidity Analysis report
By Chadi El Adnani @SUN ZU Lab
April 2024
We are proud to announce that OKX has partnered with SUN ZU Lab to bring you their first Exchange Liquidity Analysis report. This report focuses on OKX spot and perpetual futures liquidity, providing valuable insights to navigate the dynamic landscape of trading on OKX.
“During this period, the crypto market experienced a significant upswing, and OKX showed considerable trading volume and healthy order books in February 2024”, according to the analysis by SUN ZU Lab.
Link to the official announcement!
Download full report to uncover more insights
Questions and comments can be addressed to c.eladnani@sunzulab.com or research@sunzulab.com.
Disclaimer
No Investment Advice
The contents of this document are for informational purposes only and do not constitute an offer or solicitation to invest in units of a fund. They do not constitute investment advice or a proposal for financial advisory services and are subject to correction and modification. They do not constitute trading advice or any advice about cryptocurrencies or digital assets. SUN ZU Lab does not recommend that any cryptocurrency should be bought, sold, or held by you. You are strongly advised to conduct due diligence and consult your financial advisor before making investment decisions.
Accuracy of Information
SUN ZU Lab will strive to ensure the accuracy of the information in this report, although it will not hold any responsibility for any missing or wrong information. SUN ZU Lab provides all information in this report and on its website.
You understand that you are using any information available here at your own risk.
Non Endorsement
The appearance of third-party advertisements and hyperlinks in this report or on SUN ZU Lab’s website does not constitute an endorsement, guarantee, warranty, or recommendation by SUN ZU Lab. You are advised to conduct your due diligence before using any third-party services.
About SUN ZU Lab
SUN ZU Lab is a leading data solutions provider based in Paris, on a mission to bring transparency to the global crypto ecosystem through independent quantitative analyses. We collect the most granular market data from major liquidity venues, analyze it, and deliver our solutions through real-time dashboards & API streams or customized reporting. SUN ZU Lab provides Token Issuers & Market Makers with institutional standard actionable data solutions to improve the transparency and fairness of Crypto markets.
The Complete Web3 Ecosystem Mapping
By Chadi El Adnani @SUN ZU Lab
April 2024
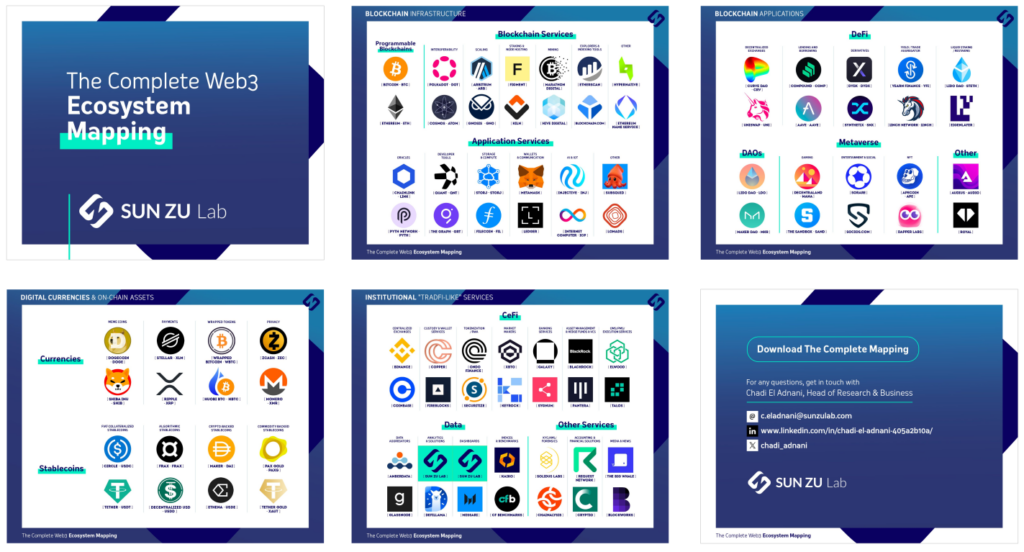
We publish today the results of our (almost) Complete Mapping of The Web3 Ecosystem, after months of research and screening the market.
With a total of more than 500 companies/projects listed, we cover the bulk of the ecosystem in terms of the relevant metrics in each category: Market cap, TVL, AUM, fees, volumes, revenue, user adoption…
The mapping’s structure is inspired by some established industry segmentations (e.g., CeFi vs. DeFi, fiat-backed stablecoins vs. crypto-backed stablecoins, on-chain vs. off-chain…), as well as our own understanding and interactions with the ecosystem’s key players.
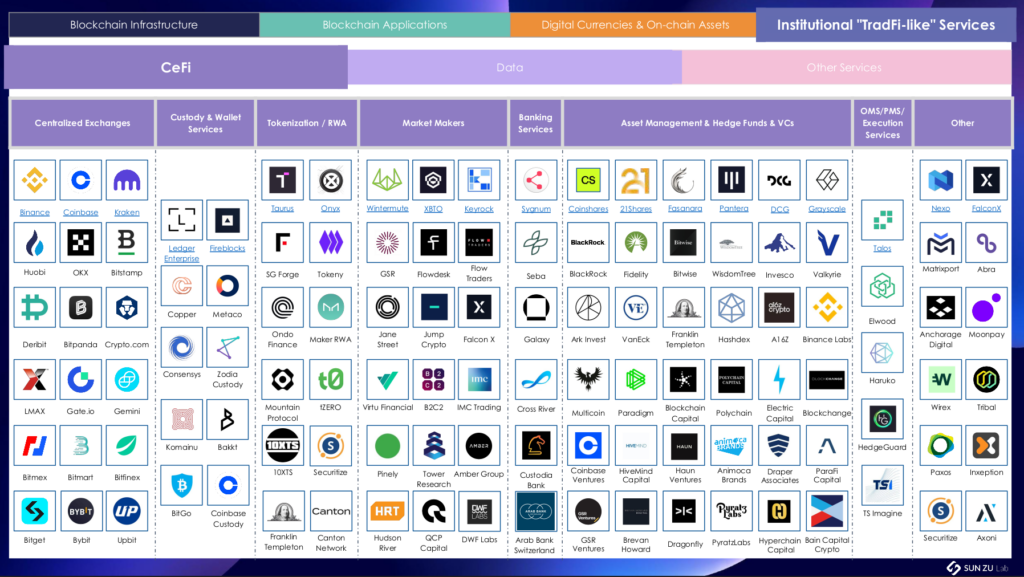
A total of 4 high-level categories: Blockchain Infrastructure; Blockchain Applications; Digital Currencies & On-chain Assets; Institutional “TradFi-like” Services, divided into sub-categories (e.g., Blockchain Infrastructure > Blockchain Services) and further down into sub-sub-categories (e.g., Blockchain Applications > DeFi > Decentralized Exchanges)
Questions and comments can be addressed to c.eladnani@sunzulab.com or research@sunzulab.com.
Link to the Complete Mapping
Disclaimer
No Investment Advice
The contents of this document are for informational purposes only and do not constitute an offer or solicitation to invest in units of a fund. They do not constitute investment advice or a proposal for financial advisory services and are subject to correction and modification. They do not constitute trading advice or any advice about cryptocurrencies or digital assets. SUN ZU Lab does not recommend that any cryptocurrency should be bought, sold, or held by you. You are strongly advised to conduct due diligence and consult your financial advisor before making investment decisions.
Accuracy of Information
SUN ZU Lab will strive to ensure the accuracy of the information in this report, although it will not hold any responsibility for any missing or wrong information. SUN ZU Lab provides all information in this report and on its website.
You understand that you are using any information available here at your own risk.
Non Endorsement
The appearance of third-party advertisements and hyperlinks in this report or on SUN ZU Lab’s website does not constitute an endorsement, guarantee, warranty, or recommendation by SUN ZU Lab. You are advised to conduct your due diligence before using any third-party services.
About SUN ZU Lab
SUN ZU Lab is a leading data solutions provider based in Paris, on a mission to bring transparency to the global crypto ecosystem through independent quantitative analyses. We collect the most granular market data from major liquidity venues, analyze it, and deliver our solutions through real-time dashboards & API streams or customized reporting. SUN ZU Lab provides Token Issuers & Market Makers with institutional standard actionable data solutions to improve the transparency and fairness of Crypto markets.
The Future of Trustless and Decentralized Cross-Chain DeFi – Focus on Interlay
By Chadi El Adnani @SUN ZU Lab
January 2023
This article was part of a broader report on the following theme: “Challenges and opportunities: The future of DeFi in TradFi”. Crypto Valley Association selected it among the top 5 pieces for its 2022 Call For Papers challenge.
Interlay came into existence based on the observation that all current existing cross-chain Bitcoin, and other digital tokens, are all centralized and custodial, like the major USD-pegged stablecoins USDT and USDC. These bridges make users give up control over their assets and trust a third party to maintain the bridge, thus creating a weak centralized link in the overall decentralized chain. DeFi Llama data shows that several dollar billions are locked in protocols that bridge tokens from one network to another, the majority of them being centralized, custodial bridges (wBTC, renBTC…), putting the whole crypto ecosystem in a catastrophic situation in case these custodial bridges are hacked, lose keys or commit fraud. Following a previous article on how Polkadot is tackling the complex blockchain interoperability problem, we analyze in this article Interlay’s potential to deliver a rock-solid decentralized cross-chain bridge.
Questions and comments can be addressed to c.eladnani@sunzulab.com or research@sunzulab.com
Introduction:
Blockchain bridges have already suffered several hack attacks, exceeding $1 billion in cryptocurrency stolen. The latest significant episodes include Axie Infinity’s Ronin bridge $600 million hack, Harmony’s Horizon bridge hack for $100 million, and the $190 million Nomad bridge hack in August 2022, described as one of the most chaotic hacks web3 has ever seen. In a much-publicized tweet earlier in 2022, Vitalik Buterin voiced his opposition to using cross-chain solutions in the blockchain ecosystem in favour of a multi-chain future, arguing that the former increase the security risks in the process of transferring assets. Indeed, the attack vectors of the assets are increased across a more comprehensive network surface area as it is moved across an increasing number of chains and dApps with different security architectures. We believe at SUN ZU Lab that a minimum of standardization is required for blockchains to co-exist in parallel. Several organizations (IEEE, ANSI…) are doing this very well, so why shouldn’t the core blockchain teams start integrating these organizations?
We will cover in this next part the specifics of Interlay, its technical design, and how it differentiates from its centralized peers.
What is Interlay?
Interlay’s flagship product, iBTC, is a 1:1 Bitcoin-backed stablecoin that can be used to invest, earn and pay with BTC across the DeFi ecosystem on Polkadot at first, with future deployment plans on Ethereum, Cosmos and many other blockchains. Interlay also deployed Kintsugi, iBTC’s canary network, a testnet with real economic value deployed on Kusama (Polkadot’s canary network). Kintsugi and iBTC share the same code base, with the difference that the former will always be two to three releases ahead with more experimental features. Interlay won Polkadot’s 10th parachain slot auction, while Kintsugi won Kusama’s parachain slot 11.
Interlay was created in 2020 by Alexei Zamyatin and Dominik Harz, who met in October 2017 as the first two PhDs in the Imperial College’s cryptocurrency research lab. They have worked together since, publishing more than 20 papers on specific problems such as blockchain security, scalability, interoperability and DeFi.
After the successful launch of its flagship product, iBTC, the company now sets its eyes on becoming a one-stop-shop for Bitcoin DeFi with a new roadmap that includes decentralized lending, borrowing and trading for BTC.
Tokenomics:
Interlay and Kintsugi will be governed by their communities via INTR and KINT, their governance tokens on Polkadot and Kusama, respectively. INTR and KINT tokens’ primary purposes are:
- Governance: token holders vote on governance proposals.
- Staking: To participate in governance, holders stake INTR/KINT and earn INTR/KINT staking rewards in return.
- Utility: Interlay will support transaction fee payments in INTR/KINT.
- Outlook: tokens will be tightly integrated into the bridge, offering token holders additional security and product benefits.
- Collateral: INTR and KINT tokens can also be used as collateral to back iBTC and kBTC.
INTR and KINT have an unlimited supply with the following emission schedule:
- 1 billion INTR and 10 million KINT emitted over the first four years.
- 2% annual inflation afterwards, indefinitely.
The project emphasizes community, with 70% of tokens distributed as airdrops and block rewards. Moreover, starting from the 5th year, only the community will receive newly minted KINT and INTR tokens.
Technology:
The Interlay network operates as follows: collateralized vaults hold BTC locked on Bitcoin, while iBTC is minted on the parachain. These vaults can be individuals or service providers who lock collateral in a MakerDAO-inspired multi-collateral system to protect users against theft and BTC loss, and receive BTC into custody for safekeeping while iBTC exists.
There are four main phases in each iBTC life-cycle:
1. Lock: users can run their vault or pick one to lock BTC. BTC is always backed by the vault’s collateral
2. Mint: iBTC is created at a 1:1 ratio to locked BTC
3. BTC DeFi: iBTC could be used as collateral for lending or yield farming, for example, on Polkadot, Kusama, Cosmos, Ethereum and other major DeFi platforms
4. Redeem: iBTC is eventually redeemed for physical BTC on Bitcoin in a trustless manner
iBTC’s main difference from existing wrapped Bitcoin products is its trustless and decentralized aspect. It is secured by insurance as vaults lock collateral on the iBTC parachain in a multi-collateral system. In case of misbehaviour, the network slashes their collateral and reimburses users. Moreover, it is radically open, meaning anyone could become a vault and help secure iBTC. However, running a vault is currently a highly technical role, requiring advanced proficiency in computer system administration, which constitutes a high barrier to entry. The Interlay team is working on democratizing this role by making it simpler to run a vault.
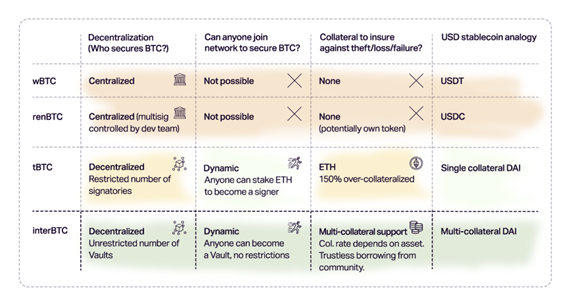
Comparison between different wrapped BTC asset
Source: Interlay documentation
Use case: BTC DeFi on Karura with Kintsugi:
Karura is Kusama’s central DeFi hub, built as Acala’s sister network (Polkadot’s first parachain winner). Karura offers a suite of financial primitives: a multi-collateralized stablecoin (kUSD) backed by cross-chain assets like Kusama and Bitcoin, a trustless staking derivative, and a DEX to increase liquidity.
Kintsugi suggests many use cases for using kBTC with Karura’s DeFi products, for example:
- HODLing BTC with interest: users can mint kBTC by locking BTC on the Kintsugi bridge, then transfer it to Karura and open a kUSD loan with kBTC. This kUSD amount can be put into another yield-generating DeFi protocol (Sushi LP pool on Moonriver, Basilisk LPs, …).
- Incentivizing kBTC pools on Karura’s AMM: kBTC can be traded against any other listed asset on Karura AMM DEX. Liquidity providers to kBTC pools could earn rewards in KAR and KINT.
- kBTC as kUSD Collateral: kUSD could be minted using kBTC, making it the first stablecoin backed by genuinely trustless and decentralized BTC.
- Arbitrage kBTC vs. renBTC on Karura’s DEX: renBTC will also be listed on Karura. While renBTC and kBTC are pegged to Bitcoin, they have different security properties and demands. This situation leads to slightly varying prices and offers arbitrage opportunities.
- Coming soon: Interlay is working on adding reward-general tokens (such as LP tokens) as collateral and releasing other types of wrapped BTC.
Conclusion
These were just a few examples of what is possible with Interlay products today, and use cases will explode shortly as the DotSama ecosystem continues to grow and Interlay expands to other protocols. Overall, Interlay has a promising future in tackling the complex decentralized cross-chain bridge problem within the blockchain ecosystem. Its founders’ solid research background, combined with its unique decentralized and trustless network, gives it a considerable advantage over its peers. However, it still has a long way to go to compete against centralized, custodial wrapped bitcoin leaders wBTC and hBTC.
References
- Understanding Crypto Bridges and $1 Billion in Thefts, by Olga Kharif (link)
- Interlay & Kintsugi Documentation (link)
- From Academia to Start-up — Looking back at 2020, by Alexei Zamyatin (link)
- Featured Use Case: Chaotic BTC DeFi with Kintsugi & Karura (link)
- Interlay FAQ (link)
Disclaimer
No Investment Advice
The contents of this document are for informational purposes only and do not constitute an offer or solicitation to invest in units of a fund. They do not constitute investment advice or a proposal for financial advisory services and are subject to correction and modification. They do not constitute trading advice or any advice about cryptocurrencies or digital assets. SUN ZU Lab does not recommend that any cryptocurrency should be bought, sold, or held by you. You are strongly advised to conduct due diligence and consult your financial advisor before making investment decisions.
Accuracy of Information
SUN ZU Lab will strive to ensure the accuracy of the information in this report, although it will not hold any responsibility for any missing or wrong information. SUN ZU Lab provides all information in this report and on its website.
You understand that you are using any information available here at your own risk.
Non Endorsement
The appearance of third-party advertisements and hyperlinks in this report or on SUN ZU Lab’s website does not constitute an endorsement, guarantee, warranty, or recommendation by SUN ZU Lab. You are advised to conduct your due diligence before using any third-party services.
About SUN ZU Lab
SUN ZU Lab is a leading data solutions provider based in Paris, on a mission to bring transparency to the global crypto ecosystem through independent quantitative analyses. We collect the most granular market data from major liquidity venues, analyze it, and deliver our solutions through real-time dashboards & API streams or customized reporting. SUN ZU Lab provides crypto professionals with actionable data to monitor the market and optimize investment decisions.
Opinion article: How a simple “heads or tails” game illustrates the importance of transparency in crypto markets?
By Stéphane Reverre and Chadi El Adnani @SUN ZU Lab
November 2022
Crypto will always fascinate us. Who would have thought that we would manage to find a link between a famous 60’s American television game show, a Kevin Spacey poker movie, a heads or tails game and crypto market liquidity transparency? But here we are at SUN ZU Lab, always striving to push the boundaries of common perceptions.
The Monty Hall problem is a probability puzzle named after the host of the American game show “Let’s Make a Deal”. The problem was initially posed and solved in a letter by Steve Selvin to the American Statistician in 1975. It became famous after Parade magazine columnist Marilyn vos Savant responded to a reader’s question regarding it in 1990. Professor Micky Rosa (Kevin Spacey) later uses it to clarify his point about the Change Variable’s importance in the famous movie Las Vegas 21, released in 2008 (link).
It goes as follows:
Suppose you’re on a game show, and you’re given the choice of three doors: Behind one door is a car; behind the others, goats. You pick a door, say No. 1, and the host, who knows what’s behind the doors, opens another door, say No. 3, which has a goat. He then says to you, “Do you want to pick door No. 2?” Is it to your advantage to switch your choice?
Counterintuitively, the odds are not at all 50-50. You have a 2/3 (67%) probability of winning by switching doors!
We would not explain why this is true using conditional probability and Bayes theory (interested readers can check the paper in the reference section). Let’s instead see the problem from the following perspective:
- There are 10 doors to pick from at the beginning
- You choose one door
- Monty looks at the 9 others, finds the goats, and opens all but 1
Do you remain with your original door (1/10 chance of winning) or the other door, which was filtered out from 9 other possibilities?
Monty is improving your 9 choices set by removing 8 goats. Once he’s done “cleaning”, you are left with the top door out of 9 for you to choose from.
The question asked differently is: Do you want a random door out of 10 (initial guess) or the best one out of 9?
Now coming back to our initial pain point, crypto liquidity transparency, the question becomes:
As a professional crypto user, do you want one random liquidity venue to execute your trades or the best of 9 liquidity venues, carefully analyzed and filtered by an independent entity?
We give another example to illustrate our opinion better. Let us consider a game with three coins: one is two-headed, the second is a biased coin that shows heads 75% of the time, and the third is unbiased. One of the three coins is chosen randomly and tossed. What is the probability that it was the two-headed coin?
Without additional information, the chances of getting the two-headed coin are 1/3 (33%). Knowing that the tossed coin showed heads, the probability becomes 4/9 (44%)!
The previous probability is computed using Bayes theorem. Let E1, E2 and E3 be the events of choosing a two-headed coin, a biased coin and an unbiased coin, respectively. A is the event that the coin shows heads:
P(E1|A) = P(E1).P(A|E1) / [P(E2).P(A|E2) + P(E3).P(A|E3) + P(E1).P(A|E1)]
P(E1|A) = (1/3) / (3/4) = 4/9
Without this crucial information, the player would be at a clear disadvantage, as it is not “fair” to play against a game master that dissimulates essential information.
What we refer to in the previous example is non-other than information asymmetry. This problem has been studied thoroughly in contract theory and economics, and regulators try to eradicate it as much as possible. Information asymmetry creates an imbalance of power in transactions, leading to severe market inefficiencies such as moral hazard risks or the establishment of monopolies of knowledge.
The general idea, put simply, is the following: Information is King! The more you know, the better (crypto investment) decisions you make. That’s why transprency is key.
Between an opaque liquidity venue on which no information is available and another independently audited for a significant period, the chances of taking the best decision are far from 50-50. While past performance is not a guarantee of future results, you should at least be able to tell if your crypto liquidity venue is sharing necessary information with you. We are convinced at SUN ZU Lab that as the crypto market matures, the need for transparency-enhancing players will materialize to the point of absolute necessity.
We would be happy to hear your thoughts about transparency in crypto markets!
Questions and comments can be addressed to: founders@sunzulab.com
References:
About SUN ZU Lab
SUN ZU Lab is a leading data solutions provider based in Paris, on a mission to bring transparency to the global crypto ecosystem through independent quantitative analyses. We collect the most granular market data from major liquidity venues, analyze it, and deliver our solutions through real-time dashboard & API stream or customized reporting. SUN ZU Lab provides crypto professionals with actionable data to monitor the market and optimize investment decisions.
Opinion article: Why has liquidity become a question of survival for crypto venues?
By Stéphane Reverre and Chadi El Adnani @SUN ZU Lab
October 2022

Having already covered in this previous article the basics of market liquidity, with a focus on crypto markets, we decided to turn our attention to a new question: Has crypto liquidity become a question of survival for crypto venues? Indeed, the current harsh global macro environment has caused a liquidity crunch across all asset classes, especially risk-on assets such as cryptocurrencies. This situation has left crypto venues with no choice but to enter a race-to-zero on trading commissions to try and protect their market share, at the expense of revenues. Is this situation sustainable? When and how is this deadly spiral going to end? This is indeed a question of survival: trading venues and intermediaries cannot afford not to monitor their liquidity against their competitors. It is fast becoming a significant competitive advantage, probably the only one that will allow a favorable re-pricing of commissions.
Amid an overall bearish year for cryptocurrencies and other risk assets, Binance-US “surprised” the crypto ecosystem recently by adopting a zero-commission policy for BTC and other cryptos. The announcement led to an all-time high of more than 600K BTC traded on Binance the day the policy took effect, while Coinbase shares fell by almost 10%.
The effect on Coinbase’s shares is not a surprise. Like any exchange, it has historically relied heavily on fees from trading volumes. Unfortunately, those have declined in sync with prices, creating instantaneous and significant pain, leading all crypto exchanges to look for ways to diversify their revenue streams.
The zero-fee trading phenomenon is not an innovation by Binance; US neo-broker Robinhood first introduced it a few years ago. Major stock brokers soon adopted the disruptive business model shift, including Charles Schwab, Fidelity Investments or E*Trade Financial. Presumably, the measure will generalize in the crypto space, which will also create tremendous revenue pressure on non-exchange liquidity providers.
In TradFi this cannibalization of revenues has been addressed in different ways. For example, large established brokers are offering premium services such as wealth management. By contrast, Robinhood is a bare-bone online broker without much in terms of service to make up for zero-fee transactions. It had to implement Payment For Order Flow (PFOF) to generate revenues.
In the PFOF model, a broker routes its clients’ orders to market makers. The market maker earns a profit by collecting a spread between buying and selling prices, paying the broker in return for the right to fill the investors’ orders. PFOF came under a harsh spotlight in early 2021 after chaotic trading by a group of retail investors on Reddit led to the spectacular GameStop short-squeeze. This episode put Citadel Securities and Robinhood on the SEC’s radar for potential conflicts of interest on how retail investors’ order flow data is being used against them. According to Bloomberg, the largest US brokerage firms earned a combined $3.8bn in 2021 for selling their customers’ stock and options orders. Interestingly even service-rich brokers adopted PFOF: Charles Schwab racked up $1.7bn, followed by Robinhood with $974m, for which Citadel Securities accounted for 22% according to the company’s 2021 annual report (34% in 2020).
Two things should be noted about PFOF:
- Firstly, it is somewhat counter-intuitive. Market-makers provide liquidity, and as such take on risk in the form of inventory. To carry this risk, they are usually compensated by the beneficiaries. For example, EUREX (a European derivatives exchange) offers market makers commission rebates, which is equivalent to outright payments. The fact that Citadel and others are willing to pay to get the flow suggests that their liquidity-providing algorithm is entirely different from that of traditional market markers. Indeed it most probably doesn’t incorporate the same constraints. The natural question then becomes: who benefits most?
- Secondly, even if it’s an impressive number ($3.8bn), we don’t know enough to assess the economic value of PFOF to parties involved. Suffice it to say that retail trading flow is indeed a very rich source of information, as “bankable” as it comes. Capital market professionals have known for long that it is the “gold standard” of un-informed trading, offering tremendous low-risk opportunities.
What’s the relationship of the above with the original crypto introduction? Well, we venture one recommendation and one supposition. Under pressure on commissions, exchanges should consider liquidity as the “gold standard” of their future profitability. Hence the recommendation: “know thy liquidity”. Monitoring it and measuring it to assess, for example, its robustness across different market regimes should become a strategic objective.
As for the supposition: the same cause having the same effects, we should expect some form of PFOF to emerge in crypto markets sooner rather than later. All of which raises again the question of value creation, repartition and eventually transparency: of the value extracted, what should the “fair” partition be? Regulators in traditional markets have looked hard at this question, and no doubt they will also consider crypto soon enough – an excellent reason to look at it beforehand.
References:
- Crypto Exchanges Cut Fees to Gain Market Share From Rivals (WSJ)
- Coinbase shares fall after rival Binance.US drops spot bitcoin trading fees (CNBC)
- Charles Schwab, Citadel Securities, Robinhood report windfall on sales of investors’ order flow (Financial News)
- Robinhood Markets 2021 Annual Report
Questions and comments can be addressed to research@sunzulab.com
About SUN ZU Lab
SUN ZU Lab is a leading data solutions provider based in Paris, on a mission to bring transparency to the global crypto ecosystem through independent quantitative analyses. We collect the most granular market data from major liquidity venues, analyze it, and deliver our solutions through real-time dashboard & API stream or customized reporting. SUN ZU Lab provides crypto professionals with actionable data to monitor the market and optimize investment decisions.
The safe-haven hunt in 2022 : is Bitcoin the answer?
By Chadi El Adnani, Crypto Research Analyst @SUN ZU Lab
July 2022
We revisit in this article a question studied by Sun Zu Lab in 2020 during the financial crisis caused by the Covid-19 pandemic: did bitcoin resist the market downturn better than other assets in 2022, and would it have been strategically interesting for investors to shift some of their positions to bitcoin before the downturn? the answer to these questions is still negative, as it was the case in 2020. We study in this analysis the behavior of various assets over the year 2022, specifically bitcoin, ether, equity markets (S&P 500), bond markets (US interest rates) and gold.
This result does not constitute an absolute answer to the intrinsic value of digital assets, but rather provides insights into a specific situation.
Economic context
2022 has been marked so far by the Russian invasion of Ukraine which, added to an economic context already weakened by the Covid-19 pandemic, has accentuated the slowdown of the world economy which could enter a long period of stagflation (low growth and high inflation). According to World Bank figures, global growth is expected to fall from 5.7% in 2021 to 2.9% in 2022, significantly lower than the 4.1% figure announced last January. We cannot help but notice the very visible parallel with the 1970s stagflation period. The comparison is striking: persistent supply disruptions that fuel inflation (Russian gas shortages, the effects of the prolonged severe lockdown in China on various value chains, etc.), coupled with the end of a long period of very accommodating monetary policy in major advanced economies: key interest rates close to 0%; Fed balance sheet in excess of $8.5 trillion (35% of US. GDP, an all-time record), etc. Added to this are projections of a slowdown in global growth and the fragility of emerging and developing countries in the face of the urging need to tighten monetary policies to curb inflation.
In this unique context, we wanted to put ourselves in the shoes of investors to understand whether it is in their best interest to move from one asset class to another, and especially whether cryptos represent an effective safe haven in times of crisis. We model the S&P 500 by its most liquid ETF: Spider (ticker SPY, NAV as of 06/17/22: $378 billion). Gold is modeled by its most liquid physical ETF (ticker GLD, $63 billion NAV). U.S. government bonds are modeled by the iShares 7Y-10Y ETF (ticker IEF, $18 billion NAV). Prices are closing prices and all execution issues are neglected. Access considerations are also neglected: the products used here are easy to access, anyone can open a securities account with an online broker or a crypto exchange in a few days. Data is extracted from Yahoo finance.
Finally, the « safe haven » concept reflects the idea that certain assets, financial or otherwise, provide a safe haven in the event of economic and financial turmoil. We often find in this category the US and German bonds, due to the almost absolute confidence in the strength of their economic fabric and their ability to always repay their debts. The Japanese Yen has often been considered a safe haven as well.
Performance
Without further ado, here is the relative performance of the 5 assets during 2022:
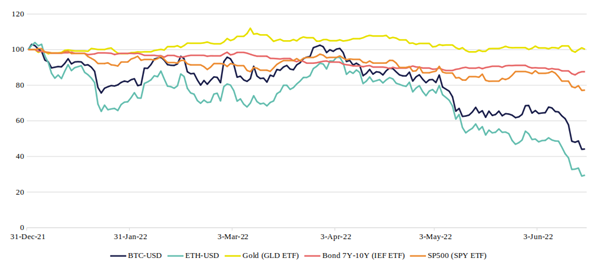
The numbers speak for themselves: only gold managed a stable performance in 2022 (0.2%), while BTC or ETH under-performed the bond and equity markets (-55.8% and -70.5% respectively).
Another way to answer the original question is to calculate the “flight to quality” percentage of investors who switched asset classes. Indeed, this type of behavior is extremely common; cautious investors forecasting the increase in interest rates and inflation at the beginning of the year might have chosen to move some of their positions to safer assets, such as gold, US sovereign bonds, or even Bitcoin? Let’s look at the results:
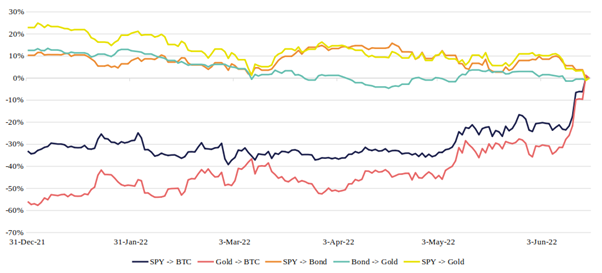
The red curve reads as follows: investors choosing to switch their position on 12/31/21 from gold to Bitcoin would have realized a loss of 56% between 12/31/21 and 6/17/22 (compared to a situation where they would have remained invested in gold). The graphs show exactly how much gain/loss was received for switching, depending on when the switch took place.
It appears that the choice to “pivot” from another asset to BTC has never paid off in 2022. Gold, on the other hand, has well played its role as a safe haven, providing positive gains at almost any time of the year on S&P > gold and bond > gold pivots.
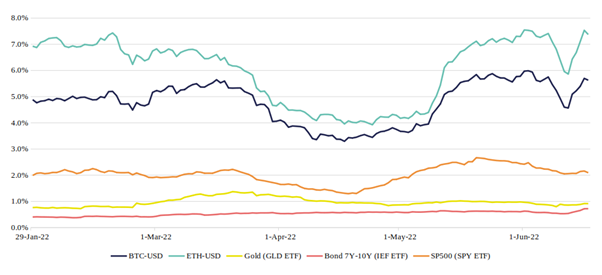
Volatility
Rather than analyzing the assets’ volatility as defined by the classic financial formula, i.e. the annualized standard deviation of daily returns, let’s look at a more intuitive measure: the intra-day variation. We compute the 30-day moving average of daily amplitudes for the five assets.
The graph shows that over the year 2022, Bitcoin and Ether have varied on average between 3% and 8% from their highest to lowest price on a single day. In contrast, the S&P 500, gold and bonds only vary by 1% to 2.5% (or even less). Investors should keep in mind then that the amplitude of movements in crypto markets is 4 to 5 times greater than in traditional markets, which requires careful monitoring to deal with these risky assets.
Liquidity
Finally, let’s analyze liquidity as characterized by daily volumes. This is a post-trade measure of liquidity, i.e. the liquidity that has been achieved through transactions. We could also study a pre-trade measure: the liquidity available before execution in the exchanges’ order books , which is a little more complex to compute.
The graphs below show average trading volumes (30-day moving average) in 2022, with 1-month volatility (annualized standard deviation) as the second axis:
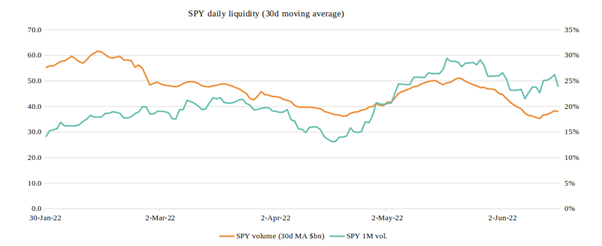
The S&P 500 ETF is one of the most liquid instruments in the world, with $30 to $60 billion traded every day. The causal relationship between volatility and volume is immediately apparent.
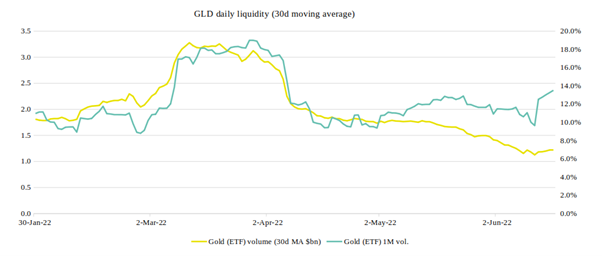
For the gold ETF GLD, we have daily trading volumes between $1 and $3.5 billion, but the causal relationship is still perfectly visible.
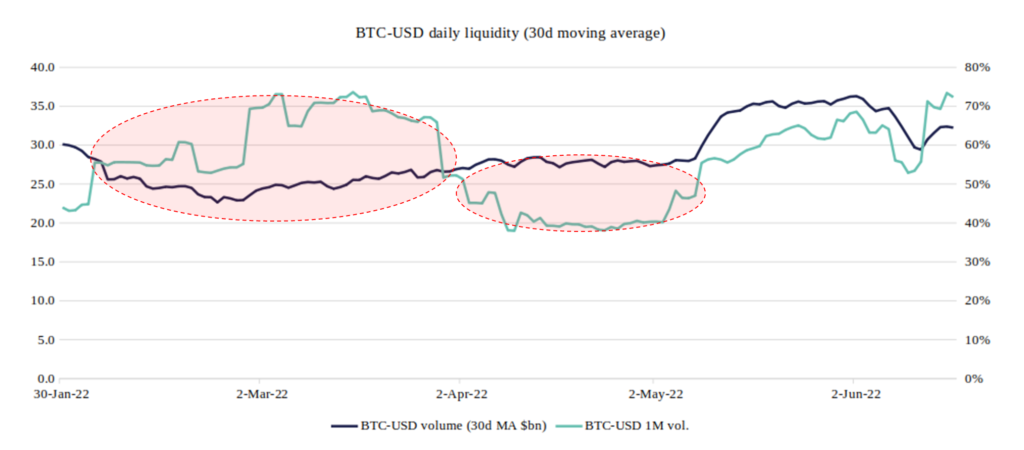
Regarding Bitcoin, we have first of all a confirmation of its very volatile character, with annualized volatility varying between 40% and 80%. This graph also raises discrepancies already made by Sun Zu Lab in 2020: it appears that the volatility/volume causality is still not respected, with peaks of volatility in February-March that are not accompanied by any increase in volume, and on the contrary periods like April when the volume seems to grow by itself!
The two circled areas on the chart are anomalies, likely due to the fact that the officially announced volumes are greatly overestimated and that the magnitude of phantom volumes varies over time. The S&P 500, gold and the bond ETF, not included here, show a rather stable “structural” liquidity: when the volatility peaks stop, the average volume goes back down to a base level.
Conclusion
The answer to the question “is BTC a credible alternative to the volatility of traditional markets?” is negative, again, over the year 2022. Unquestionably, gold and sovereign bonds are still the “safe haven” they have been for a long time. On the other hand, the liquidity of bitcoin (and ether) is still problematic; the volumes traded do not follow the same logic expressed historically by investors in the traditional markets.
Questions and comments can be addressed to c.eladnani@sunzulab.com or research@sunzulab.com
About SUN ZU Lab
SUN ZU Lab is a French Fintech that aims to become the leading independent provider of digital asset market quantitative analytics tools and services. Leveraging the founding team’s 70+ years of experience in international capital markets and trading technology, SUN ZU Lab provides crypto professionals with unprecedented liquidity analytics in the form of quant reports, dashboards, real-time augmented data feeds, and bespoke studies.