This website uses cookies so that we can provide you with the best user experience possible. Cookie information is stored in your browser and performs functions such as recognising you when you return to our website and helping our team to understand which sections of the website you find most interesting and useful.
Opinion article: Why has liquidity become a question of survival for crypto venues?
By Stéphane Reverre and Chadi El Adnani @SUN ZU Lab
October 2022
Having already covered in this previous article the basics of market liquidity, with a focus on crypto markets, we decided to turn our attention to a new question: Has crypto liquidity become a question of survival for crypto venues? Indeed, the current harsh global macro environment has caused a liquidity crunch across all asset classes, especially risk-on assets such as cryptocurrencies. This situation has left crypto venues with no choice but to enter a race-to-zero on trading commissions to try and protect their market share, at the expense of revenues. Is this situation sustainable? When and how is this deadly spiral going to end? This is indeed a question of survival: trading venues and intermediaries cannot afford not to monitor their liquidity against their competitors. It is fast becoming a significant competitive advantage, probably the only one that will allow a favorable re-pricing of commissions.
Amid an overall bearish year for cryptocurrencies and other risk assets, Binance-US “surprised” the crypto ecosystem recently by adopting a zero-commission policy for BTC and other cryptos. The announcement led to an all-time high of more than 600K BTC traded on Binance the day the policy took effect, while Coinbase shares fell by almost 10%.
The effect on Coinbase’s shares is not a surprise. Like any exchange, it has historically relied heavily on fees from trading volumes. Unfortunately, those have declined in sync with prices, creating instantaneous and significant pain, leading all crypto exchanges to look for ways to diversify their revenue streams.
The zero-fee trading phenomenon is not an innovation by Binance; US neo-broker Robinhood first introduced it a few years ago. Major stock brokers soon adopted the disruptive business model shift, including Charles Schwab, Fidelity Investments or E*Trade Financial. Presumably, the measure will generalize in the crypto space, which will also create tremendous revenue pressure on non-exchange liquidity providers.
In TradFi this cannibalization of revenues has been addressed in different ways. For example, large established brokers are offering premium services such as wealth management. By contrast, Robinhood is a bare-bone online broker without much in terms of service to make up for zero-fee transactions. It had to implement Payment For Order Flow (PFOF) to generate revenues.
In the PFOF model, a broker routes its clients’ orders to market makers. The market maker earns a profit by collecting a spread between buying and selling prices, paying the broker in return for the right to fill the investors’ orders. PFOF came under a harsh spotlight in early 2021 after chaotic trading by a group of retail investors on Reddit led to the spectacular GameStop short-squeeze. This episode put Citadel Securities and Robinhood on the SEC’s radar for potential conflicts of interest on how retail investors’ order flow data is being used against them. According to Bloomberg, the largest US brokerage firms earned a combined $3.8bn in 2021 for selling their customers’ stock and options orders. Interestingly even service-rich brokers adopted PFOF: Charles Schwab racked up $1.7bn, followed by Robinhood with $974m, for which Citadel Securities accounted for 22% according to the company’s 2021 annual report (34% in 2020).
Two things should be noted about PFOF:
- Firstly, it is somewhat counter-intuitive. Market-makers provide liquidity, and as such take on risk in the form of inventory. To carry this risk, they are usually compensated by the beneficiaries. For example, EUREX (a European derivatives exchange) offers market makers commission rebates, which is equivalent to outright payments. The fact that Citadel and others are willing to pay to get the flow suggests that their liquidity-providing algorithm is entirely different from that of traditional market markers. Indeed it most probably doesn’t incorporate the same constraints. The natural question then becomes: who benefits most?
- Secondly, even if it’s an impressive number ($3.8bn), we don’t know enough to assess the economic value of PFOF to parties involved. Suffice it to say that retail trading flow is indeed a very rich source of information, as “bankable” as it comes. Capital market professionals have known for long that it is the “gold standard” of un-informed trading, offering tremendous low-risk opportunities.
What’s the relationship of the above with the original crypto introduction? Well, we venture one recommendation and one supposition. Under pressure on commissions, exchanges should consider liquidity as the “gold standard” of their future profitability. Hence the recommendation: “know thy liquidity”. Monitoring it and measuring it to assess, for example, its robustness across different market regimes should become a strategic objective.
As for the supposition: the same cause having the same effects, we should expect some form of PFOF to emerge in crypto markets sooner rather than later. All of which raises again the question of value creation, repartition and eventually transparency: of the value extracted, what should the “fair” partition be? Regulators in traditional markets have looked hard at this question, and no doubt they will also consider crypto soon enough – an excellent reason to look at it beforehand.
References:
- Crypto Exchanges Cut Fees to Gain Market Share From Rivals (WSJ)
- Coinbase shares fall after rival Binance.US drops spot bitcoin trading fees (CNBC)
- Charles Schwab, Citadel Securities, Robinhood report windfall on sales of investors’ order flow (Financial News)
- Robinhood Markets 2021 Annual Report
Questions and comments can be addressed to research@sunzulab.com
About SUN ZU Lab
SUN ZU Lab is a leading data solutions provider based in Paris, on a mission to bring transparency to the global crypto ecosystem through independent quantitative analyses. We collect the most granular market data from major liquidity venues, analyze it, and deliver our solutions through real-time dashboard & API stream or customized reporting. SUN ZU Lab provides crypto professionals with actionable data to monitor the market and optimize investment decisions.
The safe-haven hunt in 2022 : is Bitcoin the answer?
By Chadi El Adnani, Crypto Research Analyst @SUN ZU Lab
July 2022
We revisit in this article a question studied by Sun Zu Lab in 2020 during the financial crisis caused by the Covid-19 pandemic: did bitcoin resist the market downturn better than other assets in 2022, and would it have been strategically interesting for investors to shift some of their positions to bitcoin before the downturn? the answer to these questions is still negative, as it was the case in 2020. We study in this analysis the behavior of various assets over the year 2022, specifically bitcoin, ether, equity markets (S&P 500), bond markets (US interest rates) and gold.
This result does not constitute an absolute answer to the intrinsic value of digital assets, but rather provides insights into a specific situation.
Economic context
2022 has been marked so far by the Russian invasion of Ukraine which, added to an economic context already weakened by the Covid-19 pandemic, has accentuated the slowdown of the world economy which could enter a long period of stagflation (low growth and high inflation). According to World Bank figures, global growth is expected to fall from 5.7% in 2021 to 2.9% in 2022, significantly lower than the 4.1% figure announced last January. We cannot help but notice the very visible parallel with the 1970s stagflation period. The comparison is striking: persistent supply disruptions that fuel inflation (Russian gas shortages, the effects of the prolonged severe lockdown in China on various value chains, etc.), coupled with the end of a long period of very accommodating monetary policy in major advanced economies: key interest rates close to 0%; Fed balance sheet in excess of $8.5 trillion (35% of US. GDP, an all-time record), etc. Added to this are projections of a slowdown in global growth and the fragility of emerging and developing countries in the face of the urging need to tighten monetary policies to curb inflation.
In this unique context, we wanted to put ourselves in the shoes of investors to understand whether it is in their best interest to move from one asset class to another, and especially whether cryptos represent an effective safe haven in times of crisis. We model the S&P 500 by its most liquid ETF: Spider (ticker SPY, NAV as of 06/17/22: $378 billion). Gold is modeled by its most liquid physical ETF (ticker GLD, $63 billion NAV). U.S. government bonds are modeled by the iShares 7Y-10Y ETF (ticker IEF, $18 billion NAV). Prices are closing prices and all execution issues are neglected. Access considerations are also neglected: the products used here are easy to access, anyone can open a securities account with an online broker or a crypto exchange in a few days. Data is extracted from Yahoo finance.
Finally, the « safe haven » concept reflects the idea that certain assets, financial or otherwise, provide a safe haven in the event of economic and financial turmoil. We often find in this category the US and German bonds, due to the almost absolute confidence in the strength of their economic fabric and their ability to always repay their debts. The Japanese Yen has often been considered a safe haven as well.
Performance
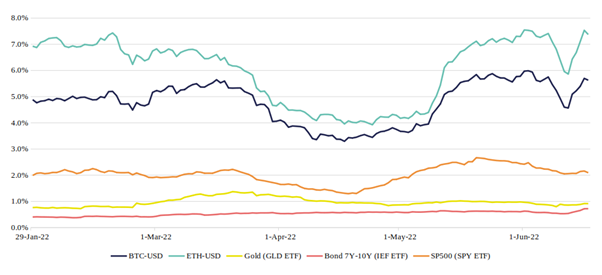
Without further ado, here is the relative performance of the 5 assets during 2022:
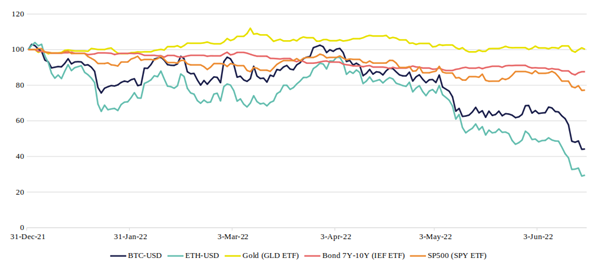
The numbers speak for themselves: only gold managed a stable performance in 2022 (0.2%), while BTC or ETH under-performed the bond and equity markets (-55.8% and -70.5% respectively).
Another way to answer the original question is to calculate the “flight to quality” percentage of investors who switched asset classes. Indeed, this type of behavior is extremely common; cautious investors forecasting the increase in interest rates and inflation at the beginning of the year might have chosen to move some of their positions to safer assets, such as gold, US sovereign bonds, or even Bitcoin? Let’s look at the results:
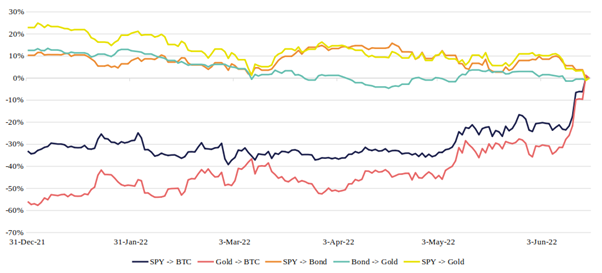
The red curve reads as follows: investors choosing to switch their position on 12/31/21 from gold to Bitcoin would have realized a loss of 56% between 12/31/21 and 6/17/22 (compared to a situation where they would have remained invested in gold). The graphs show exactly how much gain/loss was received for switching, depending on when the switch took place.
It appears that the choice to “pivot” from another asset to BTC has never paid off in 2022. Gold, on the other hand, has well played its role as a safe haven, providing positive gains at almost any time of the year on S&P > gold and bond > gold pivots.
Volatility
Rather than analyzing the assets’ volatility as defined by the classic financial formula, i.e. the annualized standard deviation of daily returns, let’s look at a more intuitive measure: the intra-day variation. We compute the 30-day moving average of daily amplitudes for the five assets.
The graph shows that over the year 2022, Bitcoin and Ether have varied on average between 3% and 8% from their highest to lowest price on a single day. In contrast, the S&P 500, gold and bonds only vary by 1% to 2.5% (or even less). Investors should keep in mind then that the amplitude of movements in crypto markets is 4 to 5 times greater than in traditional markets, which requires careful monitoring to deal with these risky assets.
Liquidity
Finally, let’s analyze liquidity as characterized by daily volumes. This is a post-trade measure of liquidity, i.e. the liquidity that has been achieved through transactions. We could also study a pre-trade measure: the liquidity available before execution in the exchanges’ order books , which is a little more complex to compute.
The graphs below show average trading volumes (30-day moving average) in 2022, with 1-month volatility (annualized standard deviation) as the second axis:
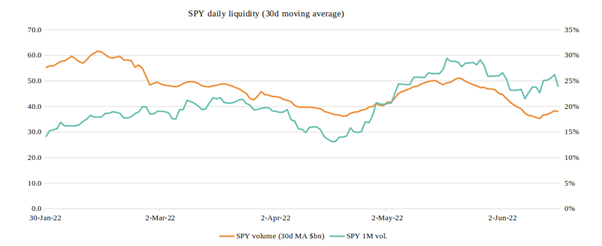
The S&P 500 ETF is one of the most liquid instruments in the world, with $30 to $60 billion traded every day. The causal relationship between volatility and volume is immediately apparent.
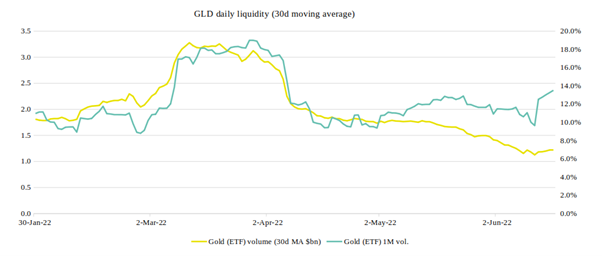
For the gold ETF GLD, we have daily trading volumes between $1 and $3.5 billion, but the causal relationship is still perfectly visible.
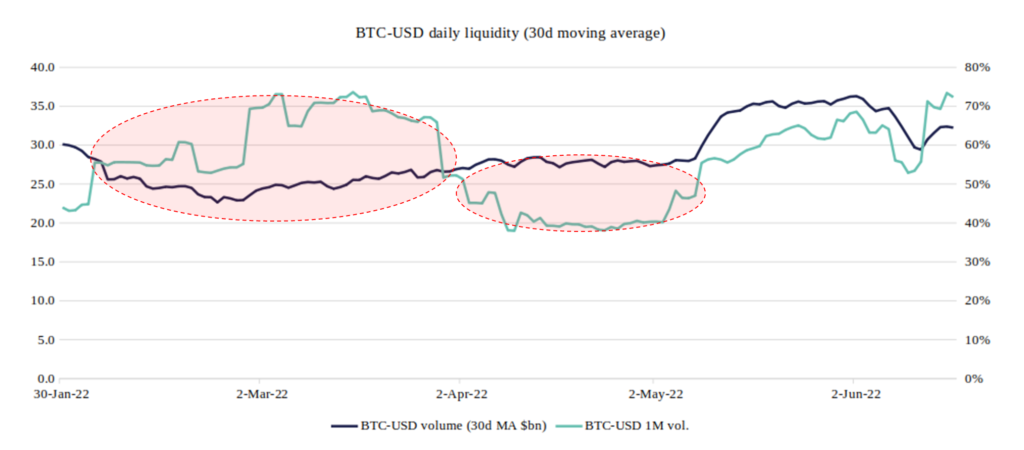
Regarding Bitcoin, we have first of all a confirmation of its very volatile character, with annualized volatility varying between 40% and 80%. This graph also raises discrepancies already made by Sun Zu Lab in 2020: it appears that the volatility/volume causality is still not respected, with peaks of volatility in February-March that are not accompanied by any increase in volume, and on the contrary periods like April when the volume seems to grow by itself!
The two circled areas on the chart are anomalies, likely due to the fact that the officially announced volumes are greatly overestimated and that the magnitude of phantom volumes varies over time. The S&P 500, gold and the bond ETF, not included here, show a rather stable “structural” liquidity: when the volatility peaks stop, the average volume goes back down to a base level.
Conclusion
The answer to the question “is BTC a credible alternative to the volatility of traditional markets?” is negative, again, over the year 2022. Unquestionably, gold and sovereign bonds are still the “safe haven” they have been for a long time. On the other hand, the liquidity of bitcoin (and ether) is still problematic; the volumes traded do not follow the same logic expressed historically by investors in the traditional markets.
Questions and comments can be addressed to c.eladnani@sunzulab.com or research@sunzulab.com
About SUN ZU Lab
SUN ZU Lab is a French Fintech that aims to become the leading independent provider of digital asset market quantitative analytics tools and services. Leveraging the founding team’s 70+ years of experience in international capital markets and trading technology, SUN ZU Lab provides crypto professionals with unprecedented liquidity analytics in the form of quant reports, dashboards, real-time augmented data feeds, and bespoke studies.
Demystifying the Terra debacle
By Stéphane Reverre and Amine Mounazil

A stablecoin is a cryptocurrency whose value is “pegged” to the price of a reserve item, the US dollar being the most commonly used reserve asset. Stablecoins appeared for the first time in 2014, and have been gaining popularity since. Today, they are considered the backbone of the crypto ecosystem by providing an “on-risk” and “off-risk” alternative for cryptocurrencies. Moreover, their adoption is driven by the demand of traditional financial institutions and the larger crypto sector for a standard approach to leverage blockchain technology while avoiding related risks.
Thus, stablecoins address one of the fundamental issues with many mainstream cryptocurrencies: their extreme volatility, which makes them inadequate for real-world transactions. Altough competition is nothing new among stablecoins, “de-pegs” are an unwelcome and novel eventuality as different projects fight tooth and nail to source the liquidity required to keep their coins close to the promised pegged value ($1 most of the time).
In this piece, we first give a brief overview of stablecoin issuance, followed by an analysis of stablecoins from a macroeconomic standpoint, before introducing quantitative insights about the recent activity that led UST to depeg and spread contagion in the digital asset market.
A brief overview of stablecoin economics
To better understand the issuance of fiat-backed stablecoins, consider each stablecoin protocol as a financial organization similar to a bank with assets and liabilities. The reserve assets (monetary units or investment securities) and liabilities (issued tokens) are matched 1:1.
However, things are different in the case of crypto-collateralized stablecoins because of the volatility of the collateral. If the value of cryptocurrency reserves falls, the system may become undercollateralized. As a result, if liabilities are in dollar-equivalent, the 1:1 backing will not hold. One way to solve this problem, and to keep the entire system safe, is to make reserve assets significantly larger than liabilities (over-collateralize). Although their exact mechanisms differ, this is how the Maker (DAI) and the Synthetix
(sUSD) protocols manage their risk.
As for algorithmic stablecoins, they are based on the idea that maintaining the value of the stablecoin over time is possible through the right set of incentives offered to market participants, in response to market conditions. In other words, the protocol itself contains provisions to defend the peg directly, as in the case for Celo Dollar (cUSD) and TerraUSD ($UST).
When it comes to non-custodial stablecoins (i.e. stablecoin that do not hold physical collateral), there are five key hazards:
- Collateral (valuation issue)
- Data Feed (the system is unable to price itself)
- Administration (parameter failure)
- The Base Layer (the underlying blockchain fails)
- Smart Contract (a bug could lead to vulnerability and eventually insolvency)
Each of these can cause the stablecoin value to fall, possibly to zero. Because they are not formally backed by collateral, algorithmic stables like $UST are especially vulnerable to collateral risk. When there is a loss of confidence, such as when the general crypto markets falls, it may lead to a bank run or “death spiral”.
The robustness of a stablecoin depends on its ability to maintain the peg by reducing the spread between its “market value” and its “theoretical value“, i.e. the value of the currency the coin is pegged to. This ability is supported by two elements: the quality of market makers and the depth of the orderbook.
Stablecoin macroeconomics
In legacy markets, a currency peg is a means of securing a currency’s stability by tying its exchange rate to another currency. A notable example is the peg of the Chinese Yuan to the dollar, managed by the Chinese Central Bank, or the Swiss franc, whose peg to the Euro snapped in 2015. Currency pegs allow governments to develop a stable trading environment free of volatility, and to effectively operate an active control of monetary flows (e.g. balance of payments, foreign direct investment etc). As a general rule, government’s foreign currency reserves must be large in order to maintain a peg. This is because, if the government has to appreciate/depreciate its own currency, it may have to do so in the open market with its own reserves, in addition to traditional tools such as raising/decreasing interest rates.
A stablecoin is in essence a digital asset designed to keep its value by being pegged to a fiat currency such as the dollar or the euro, a commodity such as gold or silver, or another crypto currency. To keep the peg, the money supply of stablecoins is extended and contracted. When the price of a stablecoin rises in relation to the peg, the stablecoin’s money supply expands. Similarly, if the price of a stablecoin falls in relation to the peg, the stablecoin’s money supply contracts.
One recurrent risk for stablecoins, or any pegged currency, is the threat of an attack aimed at breaking the peg and profiting from price discrepancies (Soros’ 92). This risk has been present in legacy markets long before the emergence of blockchain technology and decentralised finance (DeFi), and is illustrated in modern economic theory by the concept of the “impossible trinity”. The impossible trinity (or unholy
trilemma) states that an authority (say a central bank) can only have two of the following at the same time, but never all three:
- Free capital movement (i.e. absence of capital controls): citizens of a country can diversify their assets by investing overseas, thanks to capital mobility. It also invites foreign investors to invest in the country by bringing their resources and expertise.
- A fixed foreign exchange rate (i.e. a peg): a fluctuating currency rate, which is sometimes influenced by speculation, can be a cause of larger economic unpredictability. A steady rate also makes it easier for households and businesses to participate in the global economy and develop long-term plans.
- An independent monetary policy: when the economy is in a recession, the said authority can raise and lower interest rates, and when the economy is overheated, it can cut the money supply and raise interest rates.

Source : Wikipedia
We turn now back to our crypto eco-system. It is crucial to understand the tokenomics behind both assets before diving into a quantitative analysis of the $LUNA and $UST debacle. The underlying protocol, Terra, operates with two tokens ($LUNA and $UST), and incorporates a virtual automated market maker (AMM). The objective is to keep those tokens in balance to maintain the $UST stablecoin’s peg. In addition to the “algo” part, Terra is supported by the Luna Foundation Guard (LFG) and its reserves.
Market participants can mint (e.g. create) $UST on Terra by burning (e.g. destroying) an equal dollar-amount of $LUNA and are incentivized to do so. Consequently, the price of $LUNA rises as the demand for stablecoins rises: the change in $UST demand dictates how much $LUNA must be burned. As this amount is subsequently burned, supply decreases.
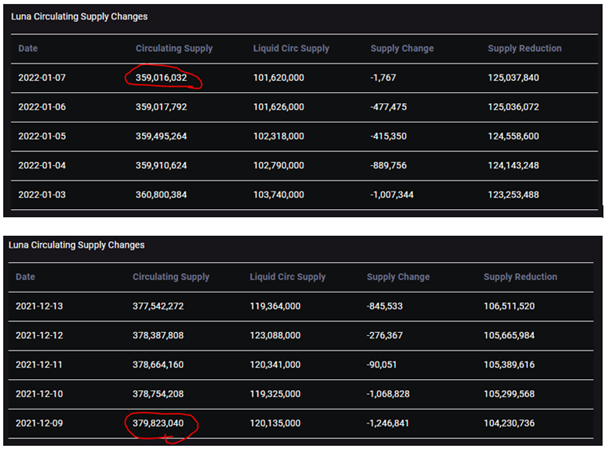
As it happens, $UST’s adoption since the end of 2021 has been parabolic, thanks to Anchor, Terra’s lending and borrowing protocol, which offered annual percentage yields (APY) as high as 19.5% on deposits. This, of course, has resulted in a reduction of $LUNA’s supply, which decreased by 5% in January 2022 alone:
Market activity quantitative insights
Now that we are somewhat familiar with the tokenomics of these protocols, we can better understand the market behavior by first reading market activity then looking at anomalies and microstructure analytics on [include venues & pairs].
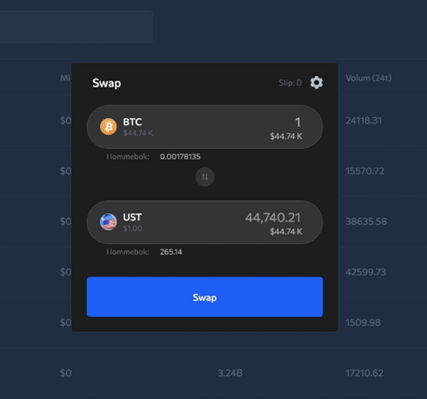
Earlier this year, the Luna Foundation Guard (LFG) raised $1 billion through a sale of $LUNA (its native token) to form a $BTC reserve, in order to maintain Terra’s stability and fund future developments. The establishment of a $BTC reserve was meant to reduce the possibility of a death spiral. So, instead of having to mint $LUNA to arbitrage the price of $UST, users can now exchange $UST for $BTC on Terra.
In April again, the LFG acquired an additional 37,863 $BTC for ~$1.5 billion, while the Anchor APY was reduced to 18%. During the same period, a massive $UST sell-off happened on Curve and Binance resulting in a small depeg that was aggravated by the withdrawal of roughly $2 billion from Anchor. The unfavorable timing has led many participants to speculate this was a coordinated attack to drive the stablecoin to depeg in order to either cripple the Terra ecosystem or trigger some sort of contagion that would result in $BTC to dip.
Historically, every known stablecoin has broken its peg at some point. Moreover, statistical evidence* shows that $BTC volatility is statistically stable with a finite theoretical variance, whereas stablecoin volatility is statistically unstable and responds to $BTC volatility synchronously.
(*) “On the stability of stablecoins”, Journal of Empirical Finance, vol. 64, 2021, Grobys et al. – Source
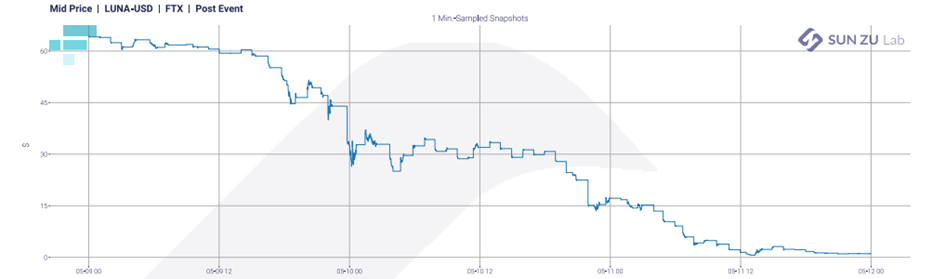
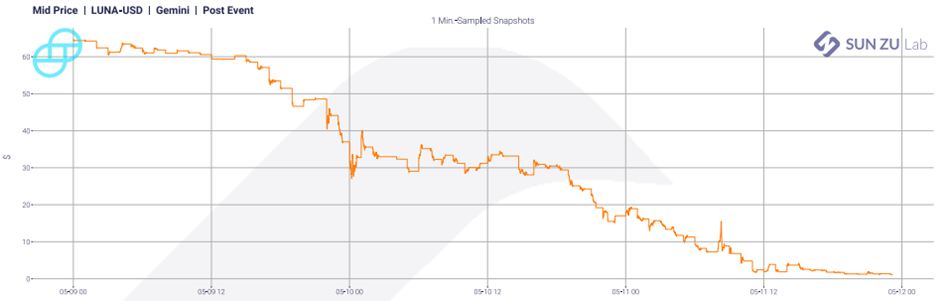
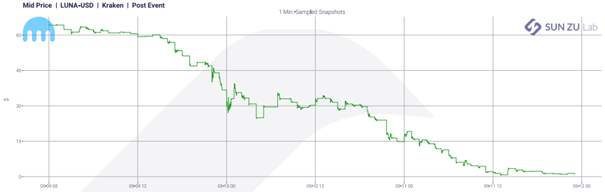
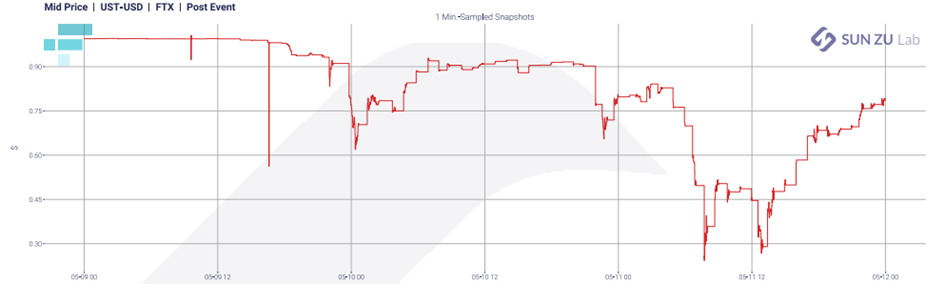
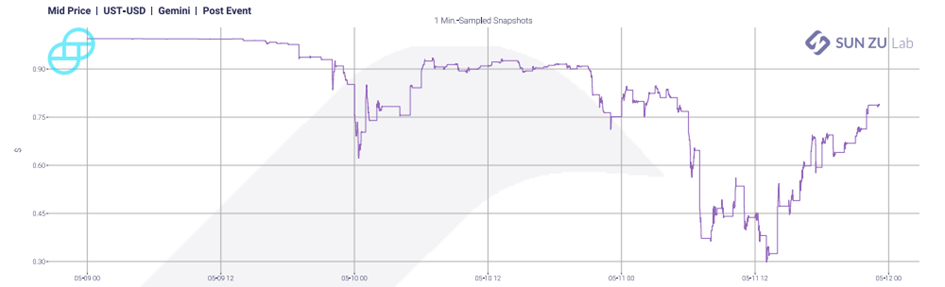
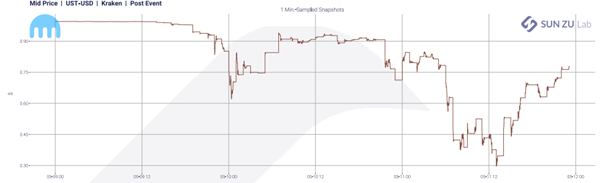
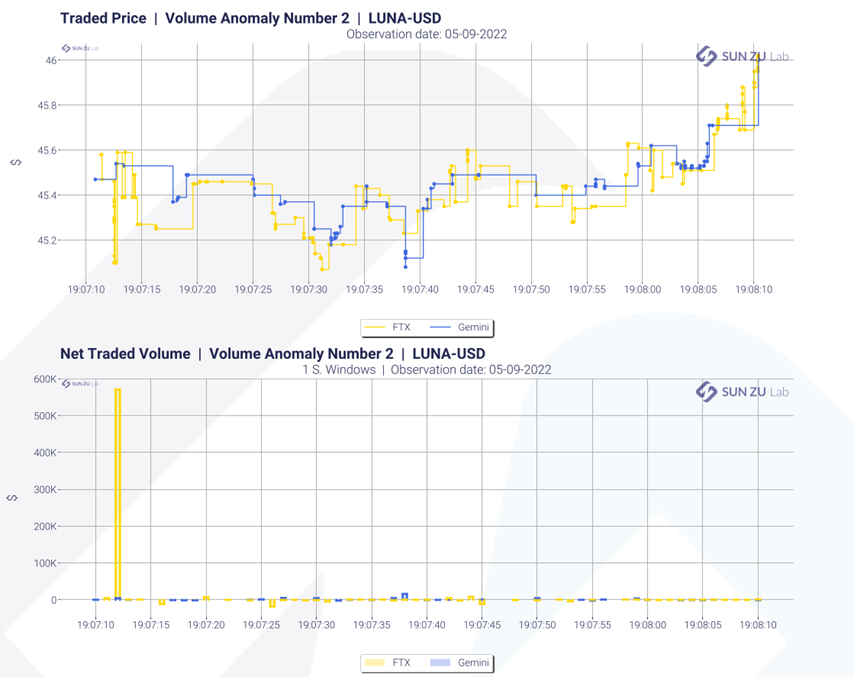
During the crash, the biggest volatility peak was observed at the beginning on May 9th at 6:20 pm. Many sale trades were observed, bringing the price down but immediately the market reacted and pushed the price back up, hence the high volatility. This selling pressure lasted exactly 1 min. The charts below show market activity for LUNA and UST on FTX, Kraken and Gemini over a few days prior to the crash (from May 5th to May 9th). Markets are still in “rebound mode” i.e., they tend to come back up even after severe down-moves, especially for UST:


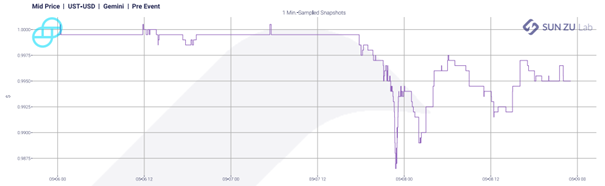
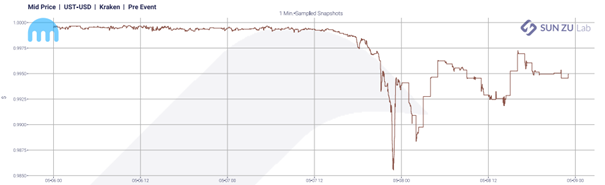
After May 9th, this “rebound” behavior disappears entirely, markets just “give-up” for LUNA, and UST trades at levels much lower than its peg value:
When zooming closer at periods where activity is very surprising (to the point where our filters identify them as “anomalies”), here is one example of what we find on May 9th:

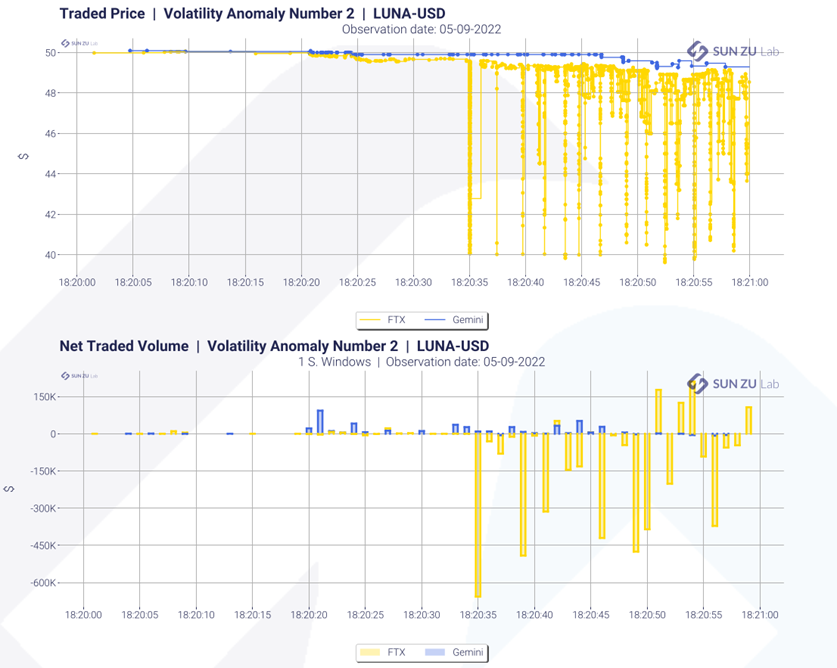
The biggest orders were sent in the middle of the crash. At 19:07 and 21:57:
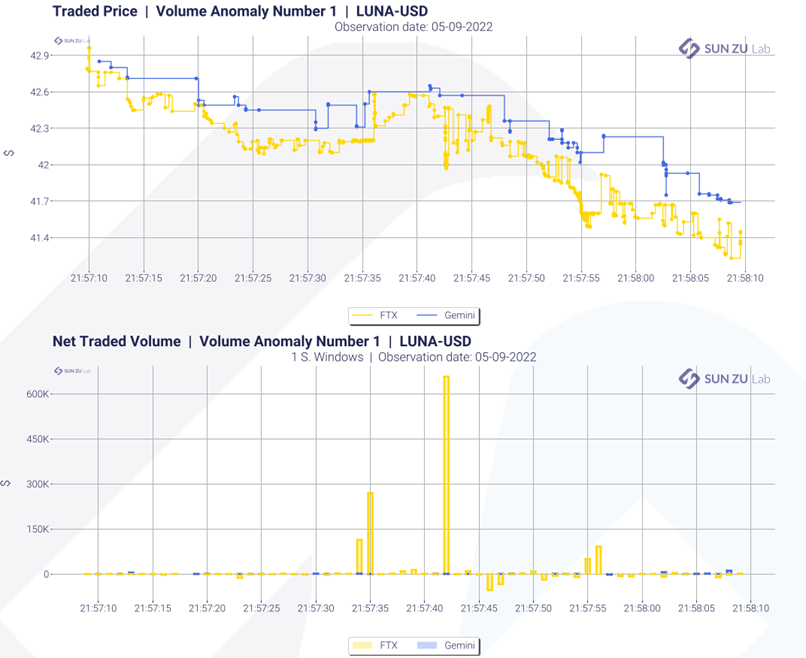
Following the crash, we observe a strong desynchronization between prices on FTX and Gemini, as can be seen below, where prices differed by more than $8 for several minutes. In addition, Gemini suffered a dramatic 9-fold decrease in market share on the LUNA-USD pair:
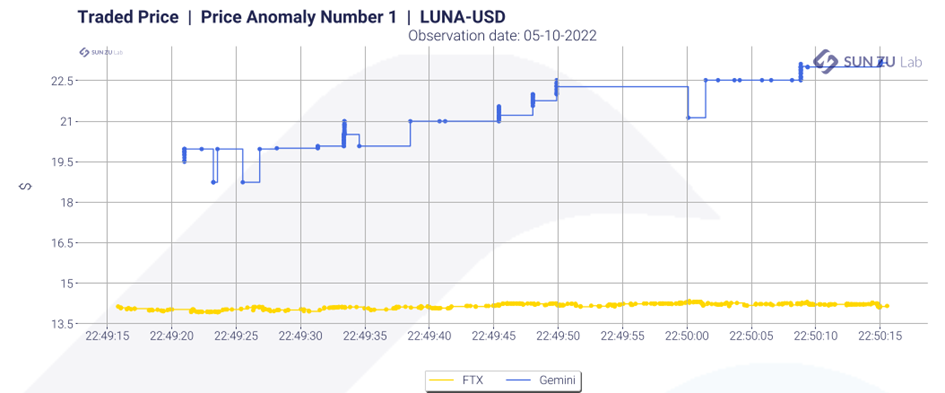
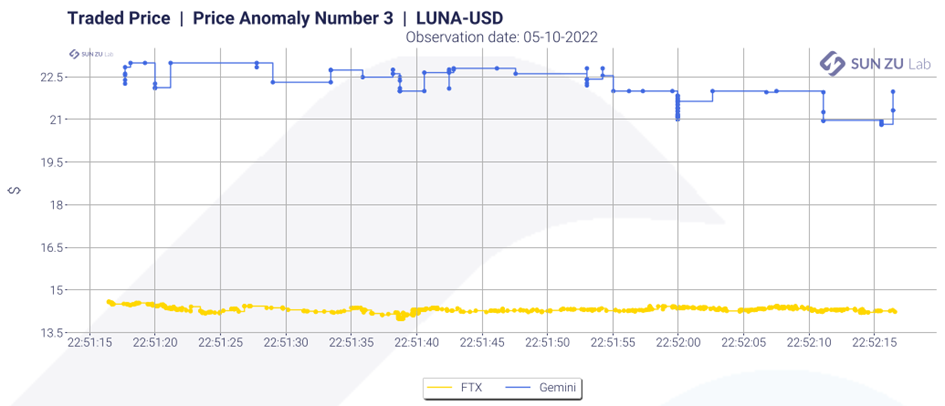

At the beginning of the crash, Gemini had a book twice as full as that of FTX, which can explain the large trades and other strange events observed on FTX. Logically, it was easier for manipulators to move the price on the market where the book was the thinnest. Following the crash however, the liquidity available in Gemini’s order book was almost non-existent.
Tether ($USDT), the crypto market’s largest stablecoin, also displayed symptoms of stress as Terra’s UST stablecoin imploded. It abruptly lost its $1 USD peg in early morning trading, falling as low as $0.95 before going back to $1.
Aftermath
On May 13th, block production on Terra was temporarily paused to prevent second-order consequences on network stability and governance caused by hyperinflating supply. Trading of $LUNA pairs was also suspended on some exchanges like Binance and Coinbase as it traded at less than a tick’s value.
In an effort to preserve the community and the developer ecosystem, Do Kwon (CEO of Terraform Labs, the company behind Terra) came up with the Terra Ecosystem Revival Plan. In order to significantly strengthen the liquidity around $UST peg, the LFG Council voted to loan $750M worth of $BTC to trading firms to help protect the $UST peg, and to loan $750M UST to accumulate $BTC as market conditions normalized. In addition, the foundation is looking to use its remaining assets to compensate current and past holders of $UST.
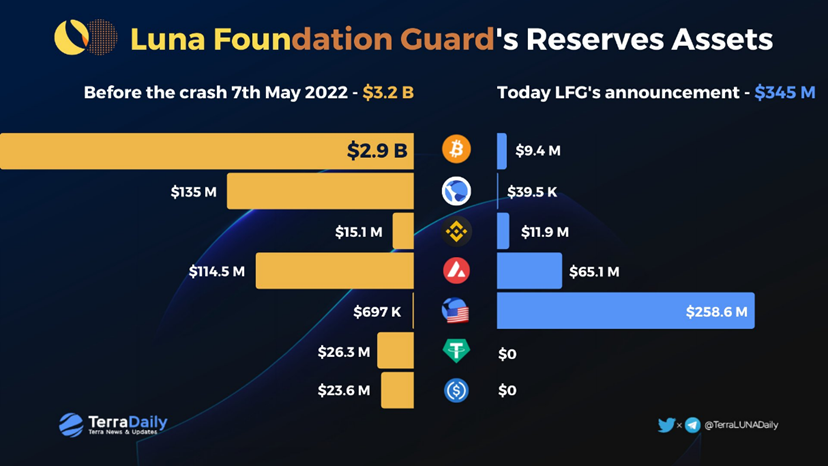
Distribution of LFG’s Reserve Assets as of 16 May 2022
On the 16th of May, Do Kwon published the Terra Ecosystem Revival Plan 2, where he imagines a fork in the Terra chain that will lead to a new chain without the algorithmic stablecoin. While the entire crypto-currency market has mixed opinions on this new experiment, it is clear once again that more scrutiny is needed to protect the small holder and protect the market from counterparty risk.
About SUN ZU Lab
SUN ZU Lab is a leading independent provider of liquidity analysis for investors already active or crypto-curious. We provide quantitative research on the liquidity of all digital assets to help investors improve their execution strategies and source the highest level of liquidity at the lowest cost.
Our product line includes research reports, software tools, and bespoke developments to fulfil the needs of the most demanding digital investor.
Liquidity Primer: an overview of Liquidity in Crypto Markets

By Chadi El Adnani, Crypto Research Analyst @SUN ZU Lab
All seasoned investors know this for a fact: the first and foremost characteristic of a financial instrument is its liquidity. In its 4 th annual global crypto hedge fund report published recently, PWC confirmed that liquidity is indeed the most common consideration for crypto funds when choosing a trading venue (cited by 39% of respondents, see below). This percentage is significant and far above the next consideration, trading opportunities, at 18%. In the wake of this finding, we felt an overview of market liquidity with a focus on crypto markets was a good idea. Too often is the concept of liquidity overlooked or taken for granted, whereas in real life it is not only critical but difficult to quantify or elicit. In this article we provide general foundations about what liquidity is, its variations and manifestations
What are the most common considerations for crypto funds when choosing a trading venue?
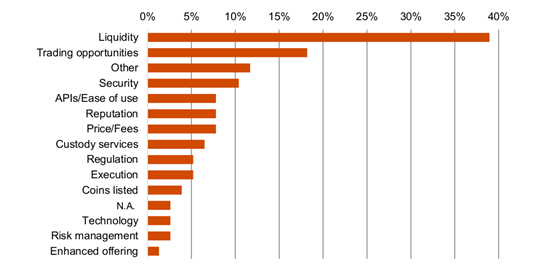
Source: PWC 4 th annual global crypto hedge fund report 2022
What is liquidity ?
We focus in this article on market liquidity, which is a different concept from monetary liquidity: a company’s ability to meet its current liability commitments. Liquidity is defined as the ability to buy or sell large quantities of an asset without significant adverse price movement. It is an important factor that investors need to assess before executing their trades, since it is a clear constraint on how quickly they can gain access to the market and subsequently how fast they can lock in a profit from a particular asset.
There exists different types of market liquidity:
We identify at SUN ZU Lab three different types of market liquidity: transaction liquidity (post-trade), order book liquidity (pre-trade) and invisible liquidity. Those notions are additive, in the sense that all three exist at the same time for a given instrument. Yet there is a timing dependency between them: invisible liquidity needs to become visible (pre-trade) before it can be consumed (post-trade).
Derivatives markets, whether in crypto or TradFi, enjoy far more liquidity than spot markets. The Bitcoin futures market, for example, saw average monthly turnover of $2 trillion at its peak, a far greater figure than BTC spot markets’ volumes. Liquidity is not only variable in time, it is also distributed in space across multiple venues. Our data shows for example that BTC trading volumes are fragmented across exchanges, as seen in the graph below (limited to 5 exchanges, and in reality there are many more creating an even higher degree of fragmentation).

Source: SUN ZU Lab data
Transaction liquidity:
Transaction liquidity refers to liquidity that has been expressed through actual trading volumes. This is an important indicator as high trading volumes usually imply less difficulty to buy or sell large quantities. Among the most liquid markets we can cite the forex market, thought to be the most liquid in the world as major currency pairs are traded by governments, banks, and even individuals. The stocks and commodities markets are very liquid as well, although intuitively no large cap or bond will ever be as liquid as a national currency.
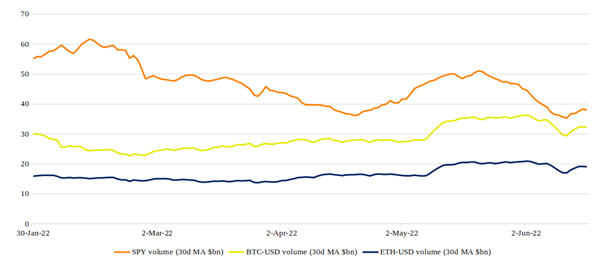
Source: data from Yahoo Finance
In the graph above, we show daily trading volumes in 2022 for the S&P 500’s most liquid ETF, Spider SPY, as well as BTC-USD and ETH-USD. The S&P 500 ETF is one of the most liquid instruments in the world, with $30 to $60 billion traded every day. Data shows that Bitcoin and Ether’s daily trading volumes vary in range between $10 and $40 billion.
These figures however need to be taken with a grain of salt due to various sources reporting that officially announced crypto trading volumes are greatly overestimated with the magnitude of fake volumes varying over time.
Order book liquidity (pre-trade):
Order book liquidity represents the total nominal (price * quantity) visibly offered across all available trading venues. This liquidity materialises as different buy/sell quantities sent by investors at different prices. Across all buy orders, the best price is referred to as “best bid”, and the “best offer” on the other side across selling orders. The mid price is quite logically the middle of those two.
A visible order book represents the underlying supply and demand of an asset in the form of individual bid and ask orders. To illustrate this, here is a chart compiled by SUN ZU Lab showing how average liquidity aggregates around mid-price for BTC-USD on three main exchanges: Bitstamp, Kraken and Binance-US on the 22 nd of June, 2022.

Source: SUN ZU Lab data
The chart reads as follows: each bar represents the average quantity of BTC (in number of BTC) offered for buy/sell orders. For example, there were on average 200 BTC offered for sale at 80bps from mid-price on the three exchanges against around 210 BTC bid offers at -80bps from the mid-price.
Order books communicate information about investors expectations and appetite. In particular there appears a new concept to qualify liquidity: the bid-ask spread, which is the difference between the highest price a buyer is willing to pay for an asset and the lowest price a seller is willing to accept. The magnitude of this spread gives a good indication about an asset’s liquidity. For example a large spread indicate poor offer and/or demand, and incidentally may drive the volatility higher. Conversely a narrow spread is an indication of a deeper market where investor’s interest is high, and volume potentially abundant for buyers and sellers to execute their trades. Bid-ask spreads for Bitcoin, for example, used to be higher than 10% in the early days of crypto, but they have dropped massively to as low as 10bps on the main exchanges as crypto adoption, investor interest and trading volumes increased over time.
Invisible liquidity:
We refer to invisible liquidity as all forms of liquidity that is not captured in public trades or order books. Note for example that liquidity exposed to a limited set of investors would qualify here as invisible liquidity (more on this below).
In general terms, the taxonomy of “invisible liquidity” is extremely difficult to establish as it depends on the structure of the market. In markets where OTC activity is high, those trades and the interaction of brokers with their client are compartments of invisible liquidity.
One could argue that those compartments divert liquidity away from other pools, yet not all investors have access to it. In markets where OTC is not developed, those liquidity pools simply do not exist.
In the world of crypto, we distinguish the following categories:
● Non-communicated, invisible orders: quantities available for trading that are yet to be communicated by investors to the markets. There is virtually no way to quantify these volumes as they only exist in a theoretical state in strategy books of portfolio managers.
● Communicated, invisible orders: we put in this category for example trading activity of dark pools, also known as Alternative Trading Systems (ATS). These are private marketplaces where investors place buy and sell orders, without the venue disclosing available prices or volumes. Liquidity has found its way to the marketplace, it is just not visible (by anybody).
● Communicated, partially-visible orders: quantities available for purchase or sale, expressed through an Indication of Interest (IOI), which refers to an investor’s non-binding interest in a security, usually communicated to a broker. In traditional markets, IOI are heavily regulated because, depending on applicable rules, they constitute visible or invisible liquidity. The regulators’ particular interest on this
compartment stems from the fact that liquidity visible only by a few agents is easily manipulable.
● DeFi liquidity: this is liquidity placed on decentralized exchanges (DEXs) without being incorporated into order books. We will dive more in detail into how liquidity pools in DEXs work in another article.
● On-Chain Liquidity: centralized exchanges (CEXs) rely on the “order book” mechanism to enable off-chain transactions: aggregate positions are “written” on chain only when investors transfer their positions out of exchanges (and de facto reclaim ownership of those on their wallets). Pure on-chain transactions today account for a relatively small percentage of total volumes. Decentralized exchanges (DEXs) are another form of on-chain liquidity, that relies on smart contracts to execute trades automatically, recorded directly (and immediately) on blockchains.
Data from Chainalysis shows that DEXs have surpassed CEXs in terms of on-chain transaction volume in January 2021, with a $175 billion volume sent on-chain to CEXs from April 2021 to April 2022, vs. a $224 billion volume sent to DEXs during the same period.
● Peer-to-Peer Liquidity: P2P is a type of crypto exchange trading that allows traders to trade directly with one another without the need for a centralized third party to facilitate the transactions. This method allows exchanging parties to select a preferred offer and trade directly without using an automated engine to execute transactions.
Liquidity risks
The main liquidity risk associated to markets is for investors not to be able to enter/exit their positions due to a lack of sellers/buyers offering a fair price. One of the markets where this type of risk is the most visible is the real estate market. During times of economic turmoil or bad real estate market conditions, it could become impossible to find a buyer at the right price even though the property may have obvious value. A perfect example for this is the experience of NBA superstar Michael Jordan in trying to sell his Chicago mansion that has been on the market for 10 years already! The over-equipped luxurious house was originally listed for $29 million, before the owner was obliged to cut the price nearly in half overtime to try and match market expectations.
There is also another psychological effect that comes into play with illiquidity; the longer an asset is listed for sale, the more potential buyers are keen to second-guess their decision as the lack of interest and competition over the asset drives its value lower.
All of this has been extensively studied in traditional finance, and has become known as the “liquidity premium”: there is a clear relationship between price and liquidity. The higher the liquidity, the higher the price. This is the reason why real-estate prices are often subject to discount when economic conditions are under stress. We provide links to research articles about this subject in the appendix.
Conclusion
Liquidity is one of the most important concepts for individuals, institutional investors as well as exchanges and market makers. Despite holding high-value assets, any of these entities may experience a liquidity crunch if such assets cannot be sold within a short period. This is turn create heavy pressure on prices.
Top crypto projects’ tokens such as BTC, ETH, BNB or SOL appear to have reached a reasonable level of liquidity, but this is not the case for the vast majority of tokens that are only listed on one or two exchanges, with very low daily trading volumes and market depths. Above all, liquidity of the entire crypto market is still nowhere near liquidity levels visible in traditional markets.
Questions and comments can be addressed to c.eladnani@sunzulab.com or research@sunzulab.com
Appendix:
- Chainalysis June 2022 report
- “Liquidity and Asset Prices” by Amihud, Mendelson and Pedersen
- “The relationship between stock price and liquidity” by Murphy Lee
- “Measuring Liquidity Premiums for Illiquid Assets” by Anson
About SUN ZU Lab
SUN ZU Lab is a leading independent provider of liquidity analysis for investors already active or crypto-curious. We provide quantitative research on the liquidity of all digital assets to help investors improve their execution strategies and source the highest level of liquidity at the lowest cost.
Our product line includes research reports, software tools, and bespoke developments to fulfil the needs of the most demanding digital investor.
Transaction Cost Analysis: the answer to all hidden costs behind crypto trading (1/2)
By Chadi El Adnani, Crypto Research Analyst @SUN ZU Lab
The “odd-eighth quotes” phenomenon
To introduce this article about Transaction Cost Analysis, we first revisit a very famous historical case. Before decimalization, the US stock market tick size used to vary by increments of 12.5 cents. This means that all prices were quoted in eighths of a dollar (ex. $12 or $12 1/8). However, on May 26 and 27, 1994, several US national newspapers reported an article that first appeared in the Journal of Finance (“Why Do NASDAQ Market Makers Avoid Odd-Eighth Quotes?”, by Christie, Harris and Schultz) raising the question of the width of the range of prices quoted by NASDAQ market makers. The researchers had found that the prices quoted to investors were almost systematically 1/4 ($0.25) apart, thus avoiding the minimum allowable 1/8 spread ($0.125)
To get a first grasp of the implications of this situation, we need to highlight that the range quoted by market makers is a good indication of the maximal margin they intend to capture. So by quoting a stock at $12 – $12 1/4 (i.e. they are willing to buy at $12 and sell at $12.25), instead of the allowed $12 1/8 – $12 1/4 range, market makers are refusing to decrease their margin bellow $0.25. So what would prevent market makers from avoiding odd-eighth quotes on 70 out of 100 actively traded NASDAQ securities, including Apple Computer and Lotus Development? The authors found no explanation and concluded that the situation was probably the result of implicit collusion among the participants to maintain wide spreads.
Surprisingly, On May 27, dealers in Amgen, Cisco Systems, and Microsoft sharply increased their use of odd-eighth quotes leading effective spreads to fall “magically” by nearly 50%, this pattern was repeated for Apple Computer the following trading day. Noticing these weird trends, the same authors published a new article a few months later to reconduct their investigation (“Why did NASDAQ Market Makers Stop Avoiding Odd-Eighth Quote?”). Using individual dealer quotes for Apple and Microsoft, the authors found that virtually all dealers moved in unison to adopt odd-eighth quotes.
These strange findings led thousands of individual investors to file a class-action lawsuit against 30 brokerage firms, including Merrill Lynch, Goldman Sachs and Morgan Stanley, which agreed in 1997 to pay about $900 million in what was called at the time the biggest settlement ever of a price-fixing lawsuit.
What is Transaction Cost Analysis?
What the researchers behind the article have provided is part of what is known nowadays as Transaction Cost Analysis (TCA). Transaction costs have become a relevant issue in Europe for example since 2007 with the implementation of MiFID (Markets in Financial Instruments Directive). The introduction of the best execution obligation gave TCA a central role, aiming for investment firms to “take all reasonable steps to obtain the best possible result when executing orders for their clients”. Moreover, MiFID’s Article 21 of Level 1 and Article 45 of Level 2 require investment firms to provide their clients with “appropriate information” about their execution policies. Clients wishing to select a firm to deal with from among a competing group need to have sight of the relevant firms’ execution policies in order to evaluate whether a particular investment strategy is suitable. By requiring ex-ante disclosure of the execution policy, MiFID addresses clients’ information needs; they should always be able to pay the lowest possible net cost (or receive the highest possible net proceeds).
Transaction Cost Analysis (TCA) is the study of trade prices to determine whether trades are arranged at favourable prices (low prices for purchases and high prices for sales). The difference between the cost of the transaction at the time the manager decided to execute it and the actual cost is at the heart of TCA, including all operating charges, spreads, commissions and fees. The resulting differential is called “slippage”.
There are usually 9 components identifiable when dealing with transaction costs, they can be classified as per the following chart:
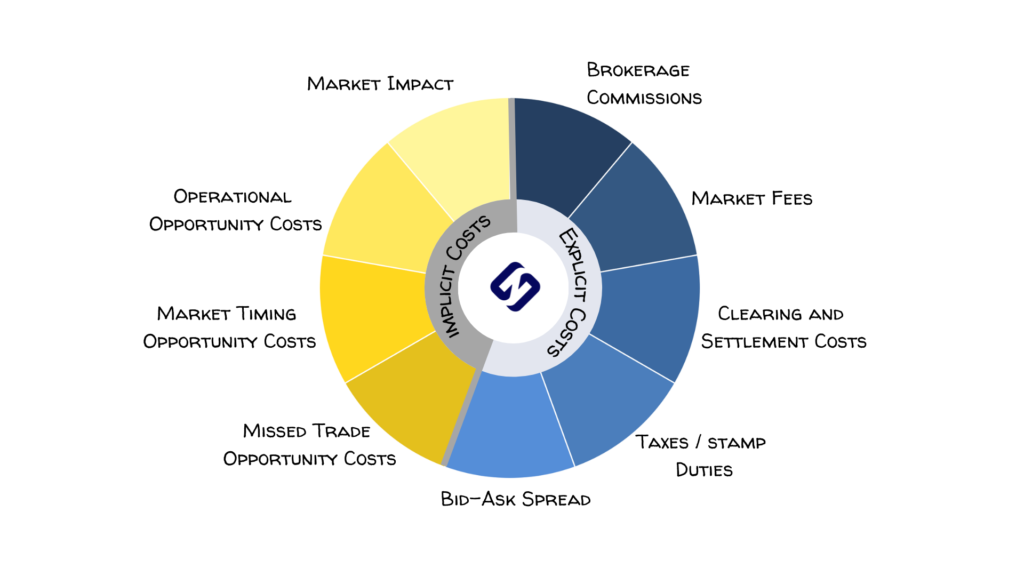
Implicit transaction costs:
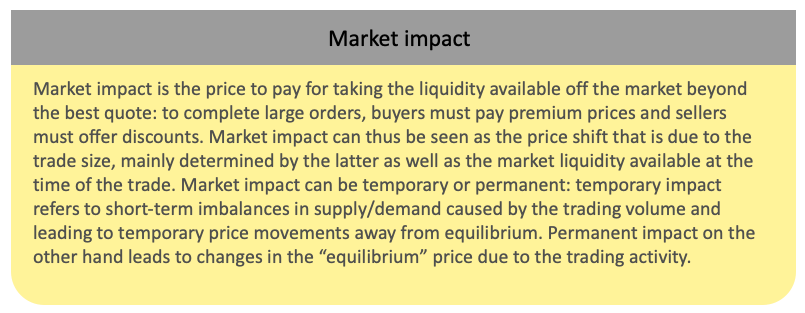
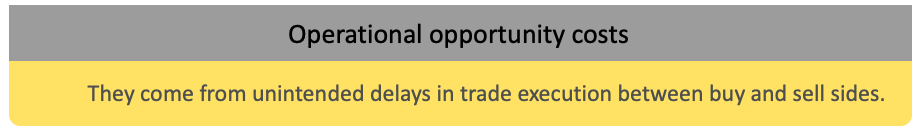
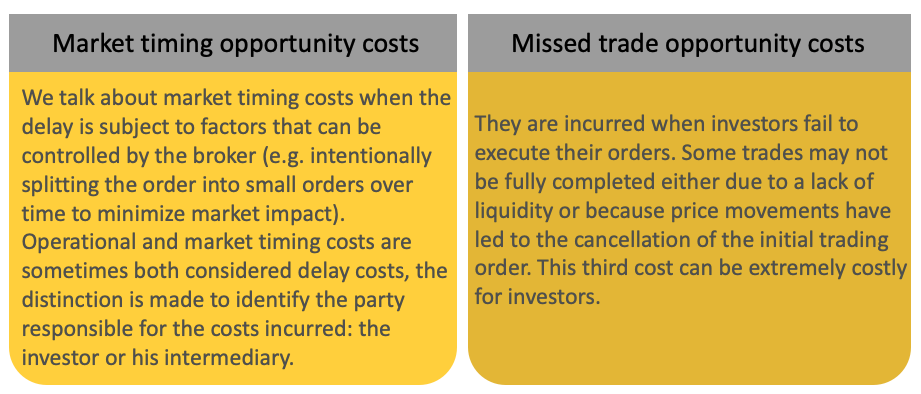
Market Impact and various Opportunity costs detailed as follows:
Explicit transaction costs:
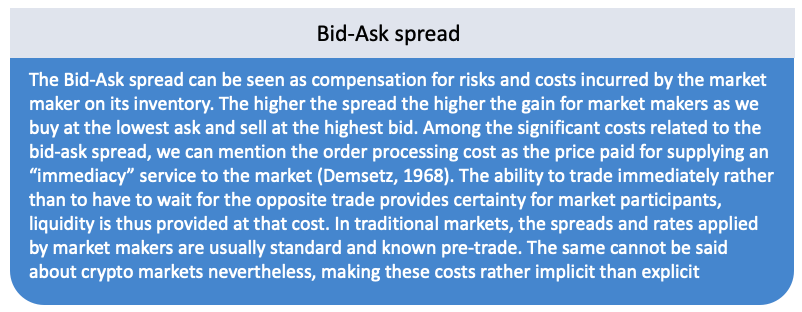
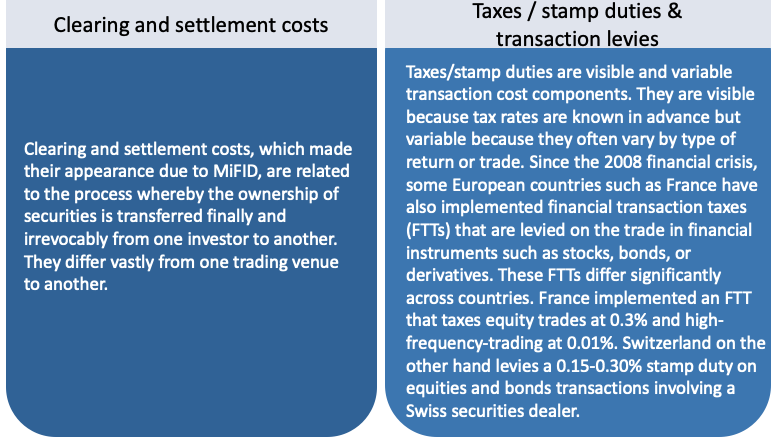
Brokerage Commisions, Market fees, Clearing and Settlements costs, Missed Trade opportunity costs, Bid-Ask spread detailed as follows:
Conclusion
The same transaction costs exist for crypto trading as well but suffer from a severe lack of transparency. The Markets in Crypto-assets (MiCA) regulation in its latest version comes however with a “best execution” obligation that should force digital assets service providers down the same path as their TradFi peers. This obligation should come with extensive quantitative analytics of order execution prices, leading to increased competition among trading venues and liquidity providers. When that day comes, institutional and retail crypto investors should be able to rely on Sun Zu Lab’s advanced and completely independent liquidity analytics to provide much-needed transparency to the crypto ecosystem.
In the next part of this article to be published, we will look at pre and post-trade TCA and analyse how this process actually works and how it helps an investment manager save money.
Questions about this article can be addressed to research@sunzulab.com or c.eladnani@sunzulab.com
Sources:
- “Why do Nasdaq Market Makers Avoid Odd-Eighth Quotes?” by William G. Christie and Paul H. Schultz, https://www.jstor.org/stable/2329272
- “Why did Nasdaq Market Makers Stop Avoiding Odd-Eighth Quotes?” by William G. Christie, Jeffrey H. Harris and Paul H. Schultz, https://www.jstor.org/stable/2329273#:~:text=On%20Thursday%20May%2026%2C%20the,quotes%20for%20active%20NASDAQ%20stocks.
- 30 Firms to Pay $900 Million In Investor Suit: https://www.nytimes.com/1997/12/25/business/30-firms-to-pay-900-million-in-investor-suit.html
- EDHEC research publication, https://risk.edhec.edu/sites/risk/files/EDHEC_Publication_Transaction_Cost_Analysis_A-Z.pdf
About SUN ZU Lab
SUN ZU Lab is a French Fintech that aims to become the leading independent provider of digital asset market quantitative analytics tools and services. Leveraging the founding team’s 70+ years of experience in international capital markets and trading technology, SUN ZU Lab provides crypto professionals with unprecedented liquidity analytics in the form of quant reports, dashboards, real-time augmented data feeds, and bespoke studies.
What is Tokenomics and why does it matter?
A brief historical perspective to better understand the stakes behind tokenomics
Let’s start this article with the famous experience of Philip II, King of Spain in the 16th century, with the Eldorado discovery and the massive rise in inflation that followed throughout the entirety of Europe!
In the 16th century, Spain conquered Latin America and discovered an immeasurable wealth within gold and silver mines. The kingdom hit the jackpot, and its financial deficits appeared long behind it. Nevertheless, this wasn’t the case; the problem came from the Crown of Spain being over-indebted to many European creditors, leading the massive silver and gold discoveries to only make a quick passage through Spain before enriching the coffers of its French and Dutch neighbors. The European market ended up flooded with coins, so the immense Spanish wealth was diminished relative to other European kingdoms.
In the end, the excessive amount of silver and gold imported, and above all distributed, in Europe caused a substantial devaluation of what Philip II could think of as his Eldorado. A better financial management could have allowed him to preserve his reserves of invaluable minerals and thus be able to develop on a more critical scale of time his fabulous treasure.
This story shows the importance of the quantity put into circulation on the valuation of an asset. This analysis works perfectly for the cryptocurrency market as well; any analysis of an asset’s ecosystem requires careful attention to the notions of quantity in circulation, total quantity, and inflation management.
Inflation and the importance of tokenomics
While the media usually describes inflation as a rise in the price of everyday consumer goods, it is, in reality, the value of money that tends to fall rather than prices getting higher. This notion of inflation is at the heart of tokenomics, a merger of “token” and “economics” used to refer to all the elements that make a particular cryptocurrency valuable and exciting to investors. In this regard, two predominant models exist: deflationary and inflationary tokens.
- The limited quantity deflationary model:
This is the model Bitcoin uses, i.e. a fixed total supply and less and less money issued over time. Many cryptocurrencies are governed under this model, like Solana, Litecoin, Tron, and many others, alongside the king of cryptos.
In the case of Bitcoin, for example, a block is mined about every 10 minutes, rewarding the miner 6.25 BTC (when Bitcoin started, it was 50 BTC per block, then 25, 12.5, 6.25, etc). The reward is halved every 210K blocks, leading to a halving every 4 years with the 10 minutes mining-time per block assumption. Without changes to the protocol, the final Bitcoin will be mined around the year 2140.
- The balanced inflation model:
Many blockchains have been coded without incorporating a limited amount of token issuance. This choice can be made for a variety of reasons, usually involving the use to be made of the blockchain in question. The Ethereum protocol, for example, operates under this model. However, some mechanisms are put in place to limit inflation or even to create a deflationary system.
This is the objective of implementing future updates of the Ethereum network. While the annual rate of ETH token issuance is currently equal to nearly 4.5%, the switch from Proof of Work to Proof of Stake should allow developers to reduce this rate to less than 1%. The network also introduced a burn mechanism, meaning that part of the fees paid by Ethereum users in the future will not be returned to validators, but will be removed altogether. This could not only achieve a balance with the issuance rate, but potentially lead to a decrease in the number of tokens in circulation in case of high network usage.
Both models have strengths and weaknesses, with reasonable justifications behind their use. For example, the Ethereum white paper indicates that a stable issuance rate would prevent the excessive concentration of wealth in the hands of a few actors/validators. Whereas Bitcoin’s deflationary system, as previously stated, allowed for the growing development of its ecosystem by paying miners large amounts of Bitcoin when it was not worth the tens of thousands of dollars it is worth today.
More generally, looking into a project’s tokenomics before getting involved is always a good idea. This can help answer questions like:
- What is the current token supply as well as total supply?
- Does the token have an inflationary or deflationary model?
- What is the real-world use case?
- Who owns the majority of coins? Is it well spread out or concentrated?
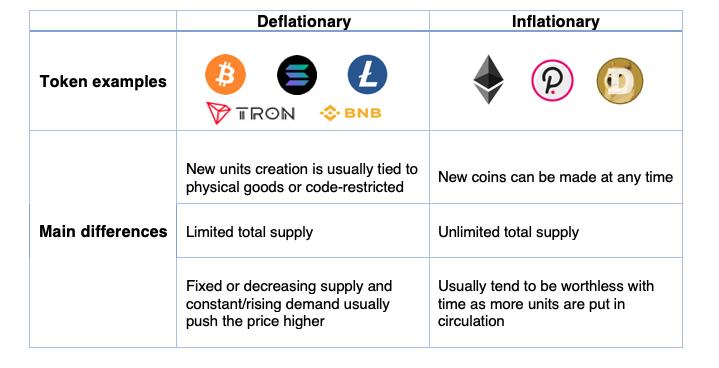
Main differences between deflationary and inflationary tokens:
Solana case study
Let’s take a deep dive into one of the most prominent blockchains’ tokenomics. Solana has a native token called SOL that has two primary use cases within the network:
- Staking: users can stake their SOL either directly on the network or delegate their holding to an active validator to help secure the network. In return, stakers will receive inflation rewards.
- Transaction Fees: users can use SOL to pay fees related to transaction processing or running smart contracts.
The Solana team distributed tokens in five different funding rounds, four of which were private sales. These private sales began in Q1 2019 and culminated in a $20 million Series A led by Multicoin Capital, announced in July 2019. Additional participants included Distributed Global, BlockTower Capital, Foundation Capital, Blockchange VC, Slow Ventures, NEO Global Capital, Passport Capital, and Rockaway Ventures. The firms received SOL tokens in exchange for their investments, although the number of tokens allocated to investors was not disclosed.
The initial distribution of SOL tokens was as follows:
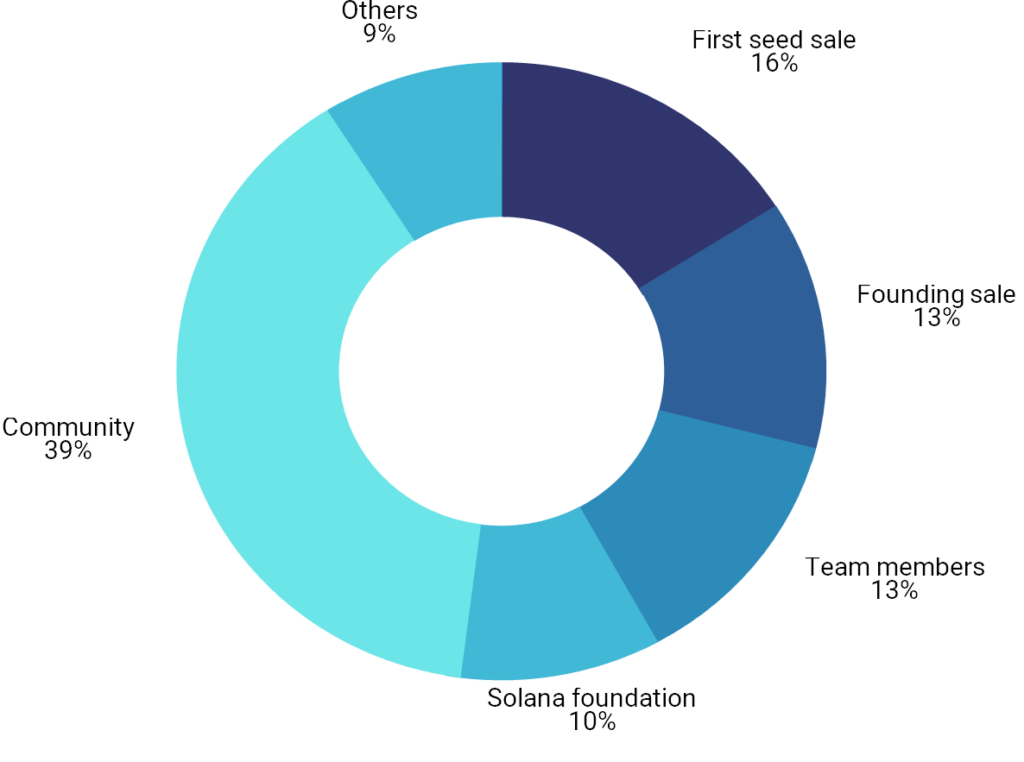
According to Messari data, vesting schedules were as follows: Solana’s three pre-launch private sales all came with a nine-month lockup after the network launched. The project’s public auction sale (held in March 2020) did not come with a lockup schedule, and the SOL tokens distributed in that sale were fully liquid once the network launched. The founder’s allocation (13% of the initial supply) was also subject to a nine-month lockup post-network launch. After the lockup period ends, these tokens will vest monthly for another two years (expected to fully vest by January 2023). This last clause is a good protection for investors as team members’ tokens are locked-up for a longer period. The Grant Pool and Community Reserve (both overseen by the Solana Foundation) contain ~39% of the initial SOL supply combined. These allocations began to vest in small amounts since Solana’s mainnet launch.
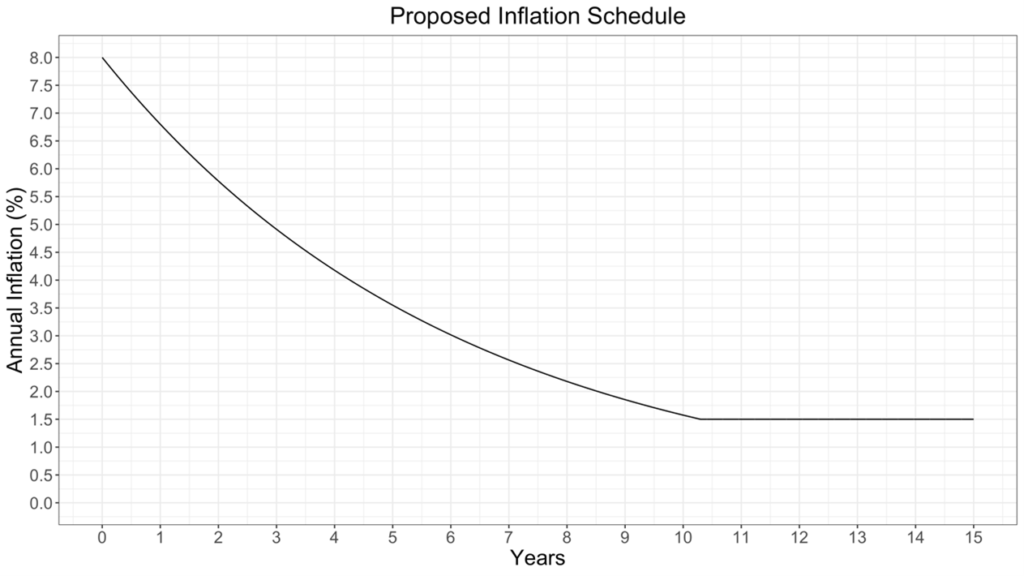
Inflation stands at an initial annual inflation rate of 8%. However, this inflation rate will decrease at an annual rate of 15% (“dis-inflation rate”). The inflation decrease is thus non-linear and much more important in the first years. Solana’s inflation rate will continue to decrease until it reaches an annual rate of 1.5%, which the network should reach in about ten years or 2031. 1.5% will remain the long-term inflation rate for Solana unless the network’s governance system votes to change it.
Major identified issues with current projects’ tokenomics
- Is it really that decentralised?
Using the Solana example, we can see that more than 50% of the tokens in circulation are concentrated, during a long period after the project’s launch, in the hands of the core team, VCs and early investors. This is hardly an exception to Solana as similar distributions are very common within the blockchain ecosystem projects. Can we talk seriously about the benefits of blockchain decentralization with such capital and governance concentration, without forgetting technical knowledge concentration as well?
- What happens after the end of the lock-up period?
Blockchain projects often come with varying lock-up periods that can last from less than a year to five years for early investors and the founding team, who usually cash out their investments after this period. What we identify as a significant issue after the end of the lock-up period is the huge and asymmetric risk-return transfer between this first group, which realized a pretty good return on their initial investments and are completely de-risked at this stage, and retail investors joining the project at a stage where core decision-makers are no longer incentivised to ensure the well-functioning of the project.
- What rights for token investors?
Cryptocurrency projects often use ICOs (Initial Coin Offering), among other fundraising techniques, to raise funds through the issue of crypto-assets in exchange for either fiat currency or an established cryptocurrency like bitcoin or ether. The issuing entity usually accounts for digital assets collected as an intangible asset, or as a financial instrument in the case of stablecoins for example as they are redeemable for cash. The accounting for tokens distributed on the other hand depends on the promise given to investors under the terms of the ICO, which could include: free or discounted access to the entity’s goods or services for a specified or indefinite period of time; a share of the profits of the entity or access to an exchange through which it can transact with other users of the exchange in buying goods or services. Digital asset projects may also offer equity tokens, which are a type of security tokens that work more like a traditional stock asset, giving their holders some form of ownership in their investments. The use of these equity instruments remains restricted nevertheless, raising the question of the rights and guarantees given to retail investors in particular in exchange for the funds given to the cryptocurrency project?
- VC Double-dipping practices
What we refer to as double-dipping practices, in this case, relates to VCs investing in cryptocurrency projects and realising important capital gains on their equity shares as well as digital token holdings. This privilege is almost unique to the cryptocurrency ecosystem, raising some questions again about asymmetric information advantages against retail investors: compared to traditional VC funding, crypto VC investors enjoy a double economic as well as governance advantage, having control over token and equity.
Conclusion:
Tokenomics is an important aspect of cryptocurrency which covers almost anything to do with the token. Professional as well as retail investors should spend a lot of time studying a project’s tokenomics before investing to be well aware of the financial and governance rights attributed to them via the token purchase. There is an absolute need in our view for regulation on this particular topic to evolve in order to provide better transparency and eventually protection levels for investors.
This article has been written by Chadi El Adnani – Crypto Research Analyst @SUN ZU Lab
About SUN ZU Lab
SUN ZU Lab is a leading independent provider of liquidity analysis for investors already active or crypto-curious. We provide quantitative research on the liquidity of all digital assets to help investors improve their execution strategies and source the highest level of liquidity at the lowest cost.
Our product line includes research reports, software tools, and bespoke developments to fulfil the needs of the most demanding digital investor.
Questions can be addressed to research@sunzulab.com or c.eladnani@sunzulab.com
Tether Reserves: at it again
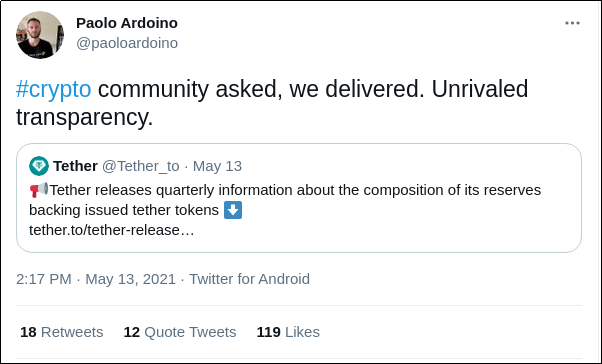
So much for “Unrivaled transparency”
As a capital market professional, I have expressed before (here) how skeptical I was about Tether and its so-called “transparency”. For all intent and purposes, Tether looks more and more like a traditional bank with “fractional reserves”, a very ancient and old-fashioned way of operating a banking business, in which the bank doesn’t hold reserves for all the money it has issued (ignoring for a second the underlying fraud that this situation constitutes in the case of Tether). For a newcomer supporting the total disruption of finance as we know it, the resurgence of a centuries-old business model is somewhat ironic. What’s even more ironic is that the old way in banking is fundamentally built on trust. Remove trust and the entire system collapses through bank runs. The blockchain technology is supposed to take us away from traditional trusted third parties. And yet here we are, asking questions about Tether reserves, which fundamentally Tether cannot answer without the certification of…a trusted third-party.
As requested in the settlement with the Attorney General of the State of New York, Tether just disclosed the breakdown of its reserves as of 3/31/2021, here. The reader will appreciate the conciseness of this report,1 single page, 2 charts — no more, no less. We are not lost in details. Considering the annual report of any decent bank today is 400-page long and quite incomprehensible, the fact that Tether operates outside any sort of regulation simplifies the task. It has been said before: the list of gaps is staggering — no risk analysis, no indication of yield, no performance measurement, no mention of who is in charge, etc, etc. And still, no audit certification, no contact information, no signatory. Good luck to all of us with questions.
The story has been picked up by mainstream media, for example, the Financial Times a few days ago (“Tether says its reserves are backed by cash to the tune of . . . 2.9%”). That anybody would buy Tether in these circumstances is extraordinary. And this is exactly what one of our clients asked us last week: “if Tether is such a big concern, why does it still trade at $1? If markets were even somewhat efficient, its value would have adjusted with the perceived risk no?”. Indeed, this is a legitimate question. After reflecting on this for a few days, here are some answers, the only ones I can provide in fact:
- The market knows something that I don’t. Fair enough. Then again, a lot of people appear not to know anything, to the point where you start wondering whether there is something to be known.
- People don’t care. This is another way of saying that the market is inefficient to the point that Tether holders neglect the risk entirely. This is not so difficult to believe: a large fraction of crypto-investors are non-professional, and as such do not approach risk analysis the way professionals do. The opportunity to make 100% in a few weeks could sweep any restraint away. As for those who do understand what risk is about, they may choose to use Tether as a means to an end, namely to access other digital assets. In doing so they would choose to hold Tether only for short periods thereby mitigating their risk significantly.
- People choose not to care. That’s a subtler one. What would happen if tomorrow Tether announced that it holds only 75% of its total issuance? 60%? 40%? The shockwave through the crypto ecosystem would be disastrous. There would probably be numerous public inquiries and lawsuits, who knows if the digital asset economy would even survive such a tsunami. Better not ask a question you don’t want an answer to.
- Finally, another option to consider: some market participants may be willing to buy Tether (also known as USDT) aggressively any chance they get when it “breaks the buck” below $1. Some of those buyers might be interested in quick arbitrage profits, but some may just be trying to bring it back to $1 because it is in their best interest. Now, who would have a vested interest in keeping the USDT at $1? Tether itself. If more USDT have been issued than the reserves allow, the excess has almost certainly been invested in other digital assets, bitcoin first and foremost. If Tether were to trade below $1, it would be fairly easy to sell those bitcoin back against USDT to maintain the level of USDT. The more Tether has been issued without reserves, the more ammunition it gives manipulators to intervene and bring the USDT back to $1.
Where is the truth? What is going on with Tether, and more importantly do we really have a way of knowing? Probably no without the help of a proper due diligence process, and only regulators have the power to make this happen.
Crypto Risk Assessment: Way to Go

Last autumn I had the pleasure of giving an introductory course on financial risk management at IAE in Bordeaux. The purpose was to provide students with a general understanding of what financial risk looks like, and what it means to “manage” risk.
Naturally, as part of the course, I had to offer a typology of financial risks i.e. a list as exhaustive as possible of all risks, their magnitude, likelihood, and to some extent the way to mitigate them.
The result is the table below: it is naturally a simplification, but not an excessive one. Listed are the risks by type, with the space of instruments they apply to, some simple ideas about possible mitigation, the first order of magnitude, and examples of things gone bad whenever possible:
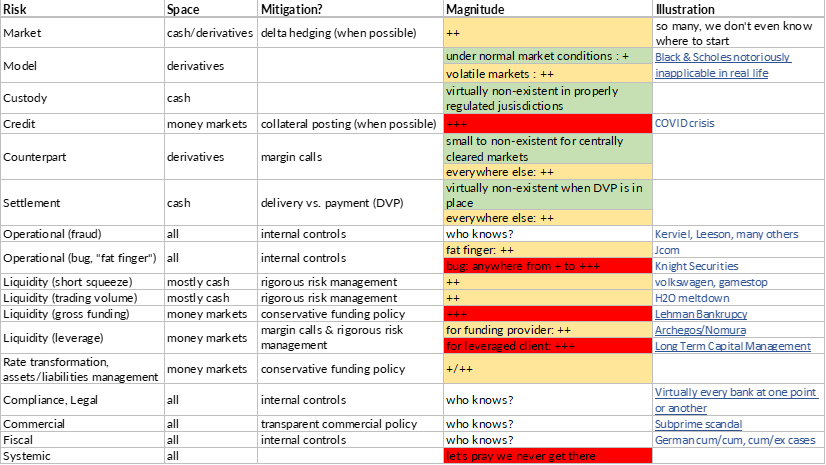
The magnitude scale is as follows (applied to capital at risk, whether it is a nominal amount for cash products or notional amounts for derivatives):
- + (very small to small): a fraction of a percent to a few percents
- ++ (medium to significant): a few percents to a few tens of percents
- +++ (high to very high): up to 100% and beyond. The vital prognostic of the firm may be engaged
- who knows? this one is exactly what it reads, possible losses range from trivial to life-threatening
The individual links do not appear in the image, so here they are with underlying URLs:
- Black & Scholes notoriously inapplicable in real life
- COVID crisis
- Kerviel, Leeson and many others
- JCom
- Knight Securities
- Volkswagen, gamestop
- H20 meltdown
- Lehman bankruptcy
- Archegos / Nomura
- Long Term Capital Management
- Virtually every bank at one point or another
- Subprime scandal
- German cum/cum, cum/ex scandal
Now it is beyond the scope of this article to go deeply into each risk, but one remark is in order: the table above could be much redder, and was such in fact not too long ago. Indeed, many of the risks have turned out to be manageable because the industry has structured itself to address them. I have written before about the operational governance in capital markets, this governance is the result of a long slow evolution. A lot of money has been invested (and still is) into market infrastructure, to vent several types of risks out of the system.
A few examples to illustrate the point: independent clearinghouses, heavy regulation of depository institutions, SWIFT massaging infrastructure, standardized master agreements (notably from professional organizations such as ISDA, ISLA, ICMA, etc), delivery-vs-payment settlement to name but a few.
What’s the situation in the realm of digital assets? Are we better or worse in an ecosystem that is much younger, and not yet dominated by highly-capitalized international financial institutions? Supposedly fintech are nimbler and consequently more adaptable.
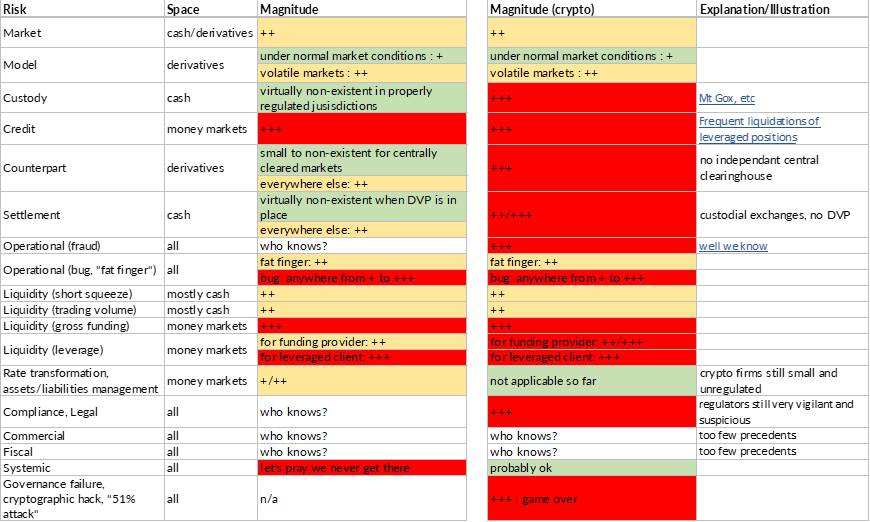
The table below summarizes the main differences (well, at least as I see them):
Like before the links have disappeared in the picture, here they are:
Naturally the above is subjective, and I am quite certain many bitcoin proponents would object. Regardless, there is little doubt that it is redder than the previous table, and for good reasons: most of the infrastructure in place in traditional markets doesn’t exist in crypto. For example, exchanges are “custodial” i.e. you need to deposit both fiat and crypto before you can trade. There is no single (cash) exchange in traditional markets that accepts deposits from its members and/or participants.
The question of settlement and money flows is addressed somewhere else in the industry (that’s exactly why clearinghouses have come to exist, and those do require deposits from the select firms they accept as members). Even when you settle a trade with a stable coin such as Tether, you still carry the specific risk of Tether. The same applies to derivatives: in the absence of a central clearinghouse, exchanges manage the entire process, and there can be no assurance for an investor that he will be able to recoup his funds should the exchange go under.
Reward doesn’t go without risk and vice versa. The reason why crypto is such a gold rush right now is exactly this: risk is high, widespread, and probably very poorly understood. Investors who made a lot of money should probably ask themselves: what risk did I really take? Am I out of the woods now? Which one(s) do I want to take going forward?
To end on a positive note, one risk has disappeared, and that’s for the better: the systemic one. If bitcoin went to 0, or if a large crypto participant went under, chances are the overall economy would not suffer much. This incidentally is why regulators worldwide still do not want to intervene. They are vigilant, suspicious because part of their mandate is to protect the “small” guy. But from a risk standpoint, they can still afford to let the crypto space mature and regulate itself.
Arbitrage on digital assets
How we built a quantitative indicator on market integration
There is a lot of talk about arbitrage in the world of digital assets. Myth or reality?
We at SUN ZU Lab wanted to provide the necessary tools to examine this question and provide reliable answers. Therefore we designed a quantitative indicator to detect macro arbitrage opportunities when markets fall out of synchronization. Our goal was to produce an indicator that captures the existence and broad magnitude of price discrepancies between markets on the same asset. A secondary objective was to determine to what extend those discrepancies appear and disappear based on market behavior (e.g. volatility) or geography (e.g. region).
To that effect, we built our indicator which we denote “arbitrage index” (AI) calculated as follows. Let amp(1’, t) be the 1-minute volume-weighted average price (VWAP) amplitude:
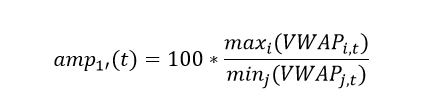
i and j are indices on markets. VWAP is the volume-weighted average price on a given market at time t. In plain English, amp(1’,t) is the ratio of the highest VWAP to the lowest VWAP across all included exchanges for a given 1’ interval. The arbitrage index (AI) is the hourly average of all amp(1’,t).
This indicator fulfills our need:
- In the absence of price discrepancies between two markets, their respective VWAP over a given period of time are very close if not equal. In the above formulation, this translates into: amp(1’) = 1 at any point in time. This idea can be easily generalized: adding more markets trading at the same price will keep amp(1’) close to 1.
- By construction amp(1’) > 1, and so is the index AI. A deviation in price will result in a deviation of AI from 1.
- Because AI is an average over period of 1 hour, short-lived deviations tend to be averaged out. For AI to differ significantly from 1, there needs to be significant variations for short periods, or smaller variations that last. The indicator is not meant to distinguish between the two situations, but it clearly shows when prices are not aligned.
- The index is only dependent on trade data, not order book data. This is helpful because order book data (also called level III) is quite difficult to obtain. Many exchanges offer periodic “snapshots” but intractable issues potentially arise when processing those snapshots, first and foremost the fact that they are not synchronized.
- Comparing market integration across space is relatively simple: markets are grouped by region, and by construction, all min/max ratios are limited to intra-group comparison.
Market professionals will find that this indicator is too “macro” and not precise enough. Indeed, it is true that this methodology leads to only a gross estimation of real-life price discrepancies. A rigorous analysis based on tick-by-tick analysis would yield much more robust estimates, as they are seen in real time by active traders (by the way we do agree and will move in that direction!). Nevertheless our indicator does a fair job at showing relative market integration, both in space and in time, which is exactly its objective.
For the purpose of practical calculations, markets have been grouped in three regions:

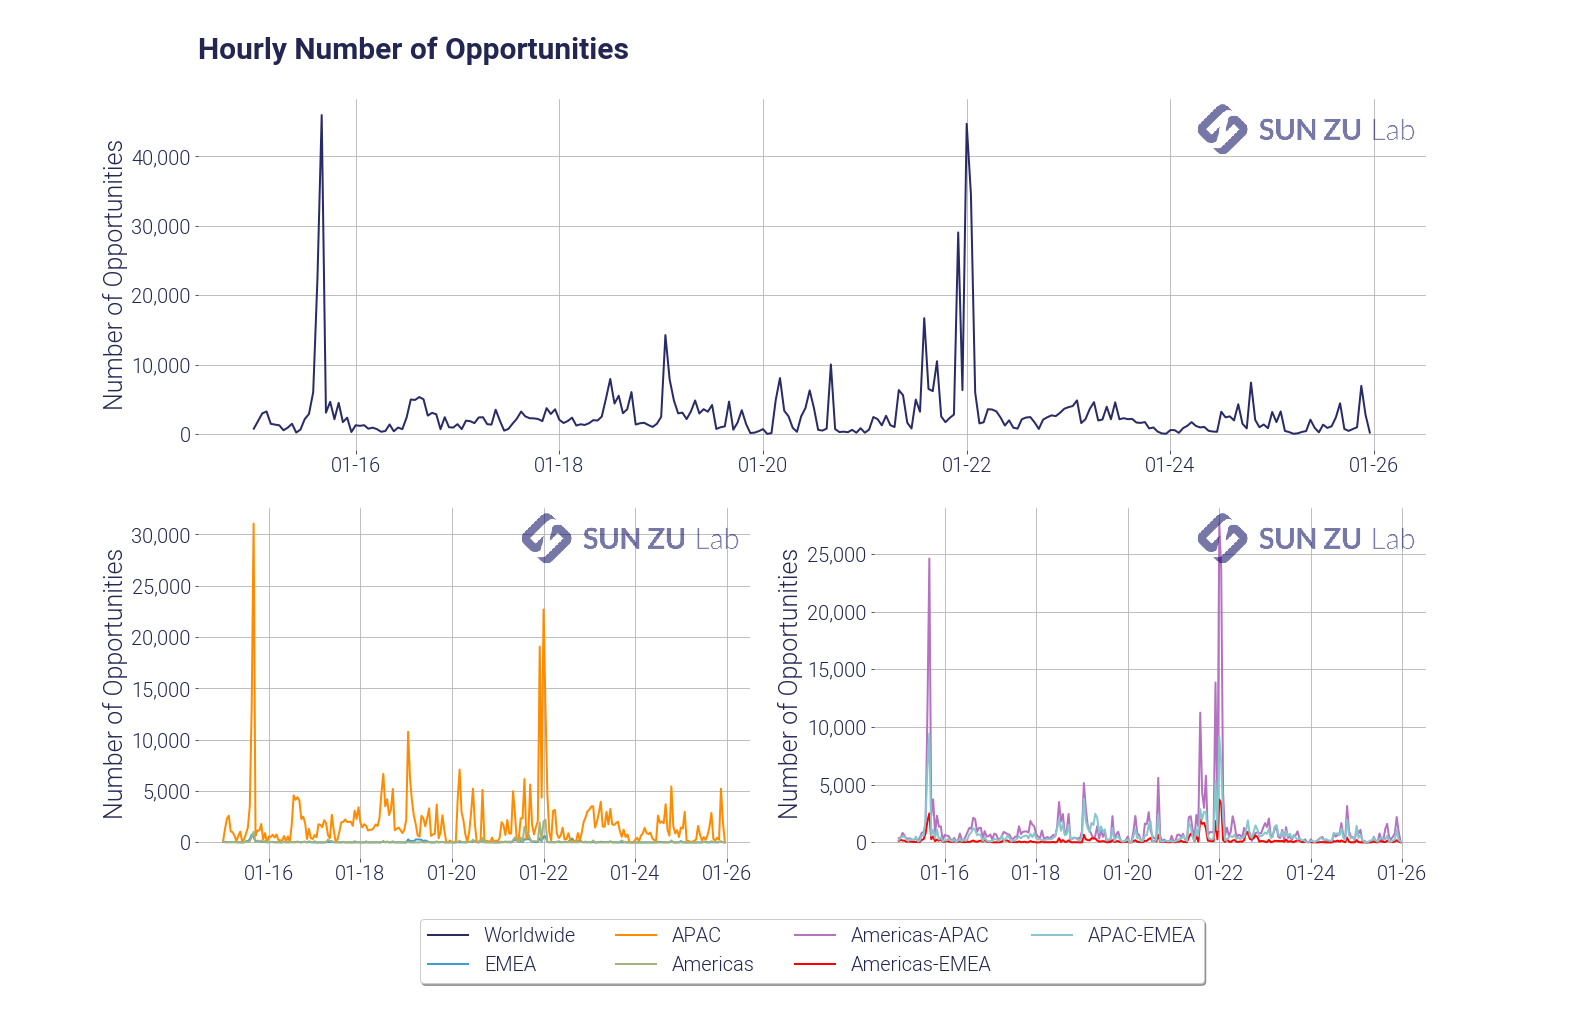
The chart below presents the index globally (top), by region (bottom left), and inter-region (bottom right):

It appears the index differs significantly from 1 during the period, which clearly shows that market are far from being closely integrated.
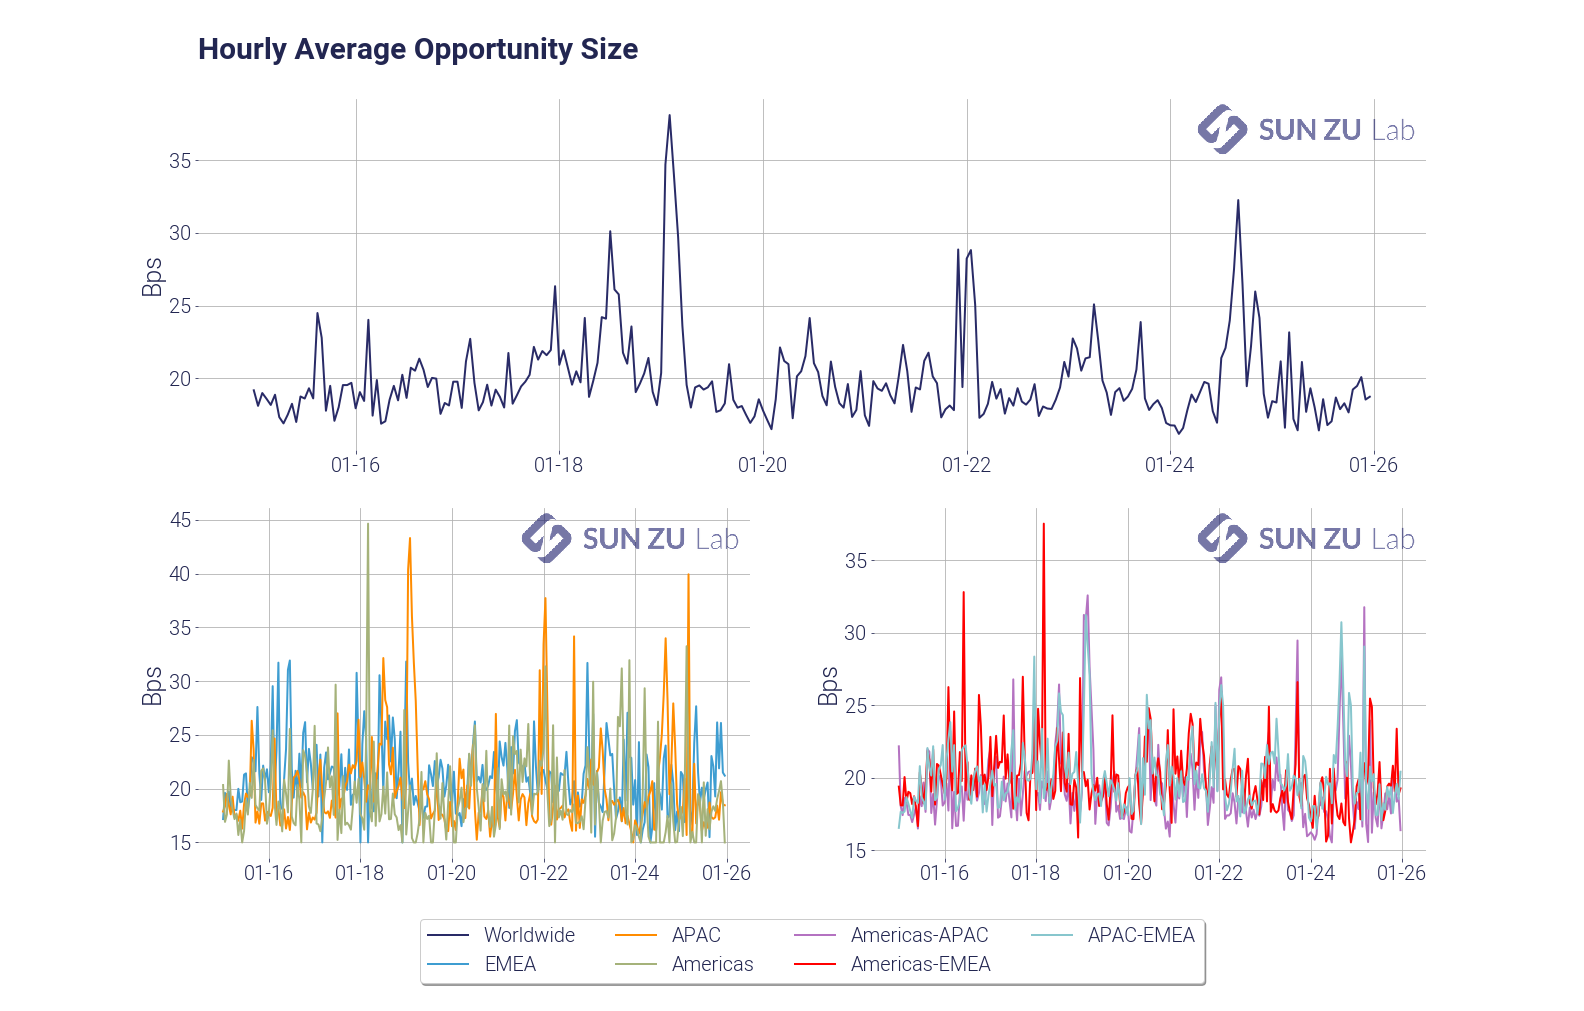
The following charts show volatility, and the cross-reference between the index and volatility:
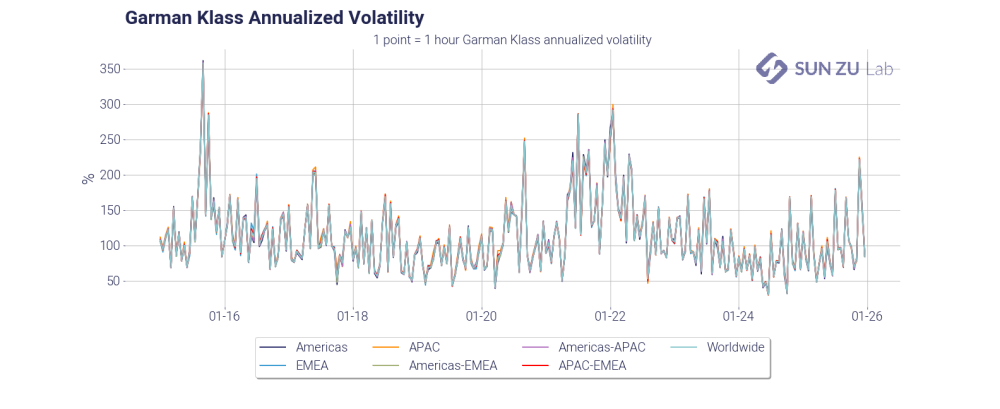
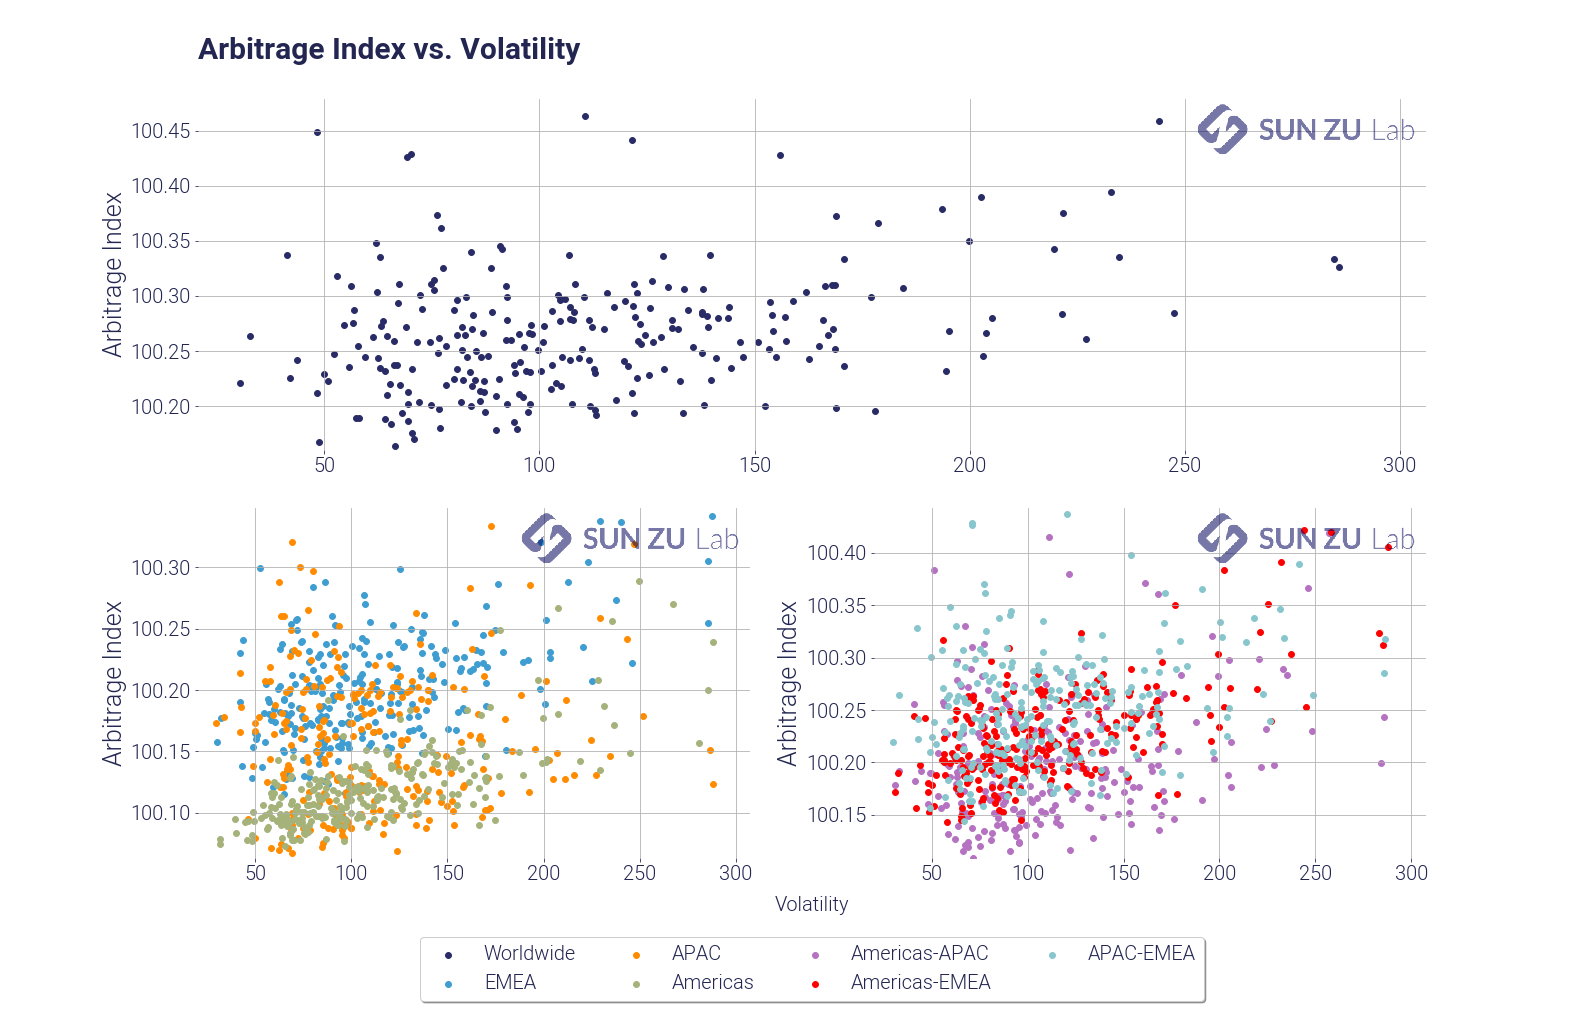
Even though the relationship between the two doesn’t appear to be straightforward, there is a strong sense that the indicator does indeed increase for volatile prices. At the same time it is fair to conclude that volatility is not the only factor responsible for prices being out of sync.
We go one step further in our analysis and produce a “theoretical P&L” based on opportunities we detect. What is an opportunity? As it happens crypto exchanges produce a useful indicator for each trade: the side of the trade (bid or ask). Based on this indicator it becomes possible to isolate price discrepancies that could be seen as an arbitrage opportunity by participants. Here is our methodology:
- for each incoming trade, we know the price, quantity, side and timestamp. We look back at each transaction that preceded across all exchanges in the same region, within a 500 ms window. This last parameter has been fixed arbitrarily, but is meant to capture the “typical” time window needed for traders to identify and capture opportunities. Our liquidity report shows for example the mean time between trades for different exchanges, and it is typically between 500ms and 2s. For a trader to lock an arbitrage there would have to be at least two orders sent at the same time, immediately after the price anomaly is detected. We hypothesize that the latency to post those, combined with the latency for detection, is at most 500 ms. In some cases a market maker may already be present in the order book on one side, in which case there would only be a single order to send. We are very mindful of our choice for the time window, and further research may lead us to refine our model.
- If we find in the previous 500 ms window a trade with an opposite side and better price, we consider an opportunity appeared. For example with a transaction of 1 BTC at $10,000 (a very hypothetical price these days) registered on the offer of one exchange, we scan the preceding 500 ms for transactions on the bid, at a price higher than $10,000. The existence, within this time frame, of those two transactions suggest that at some point the bid of one exchange was strictly above the ask of another, thereby creating an opportunity that would have been seen by all and possibly captured.
- When two transactions are paired, we consider the minimum size of the two to be consummated and not available for subsequent pairing. This way we make sure that volume for each transaction cannot be included in two distinct opportunities. We then increment several counters: the number of opportunities, the theoretical P&L, and the arbitrable quantity.
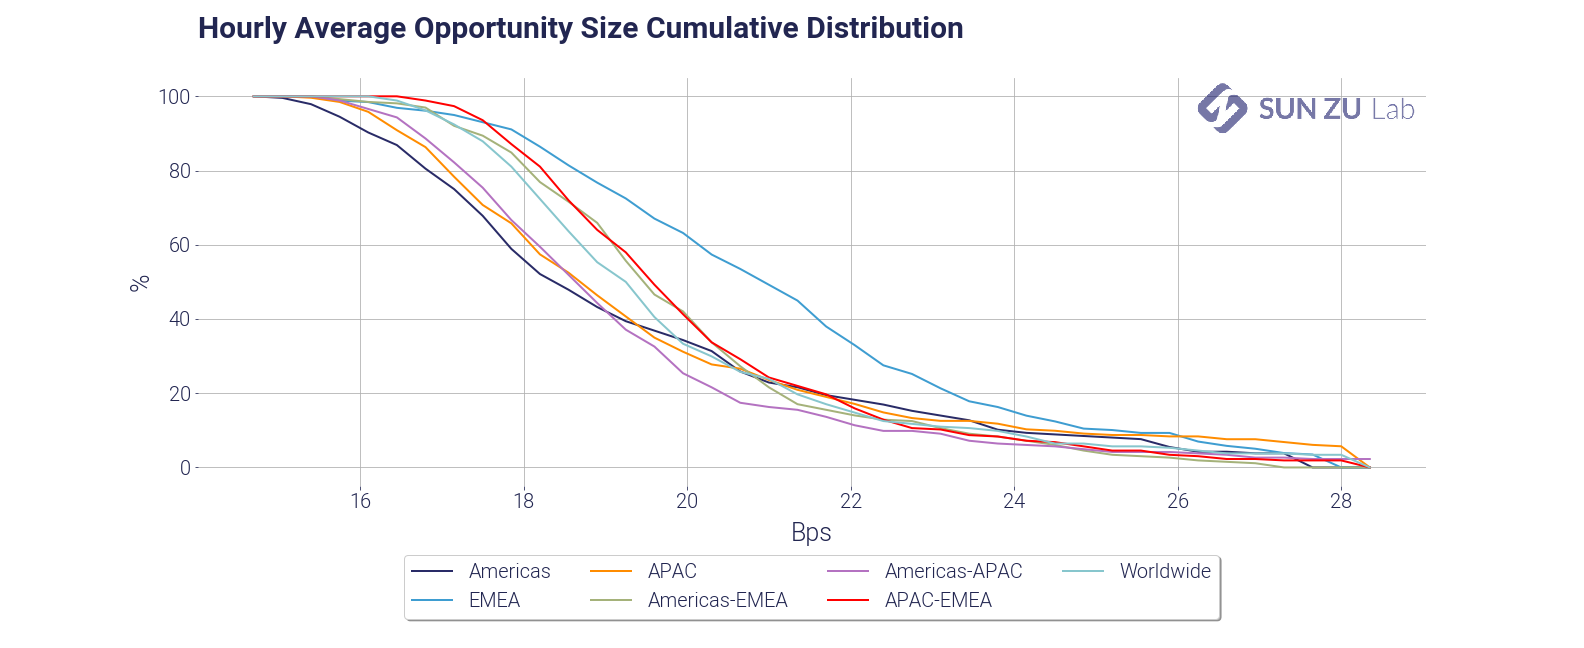
- We also filter out all opportunities below a minimum threshold (15 bps in the charts below) to keep the noise level under control, and accounts for wide differences in execution circomstances. For example a market maker physically located near an exchange will probably enjoy fairly low trading costs and latency. It is naturally impossible to account for the variety of situations, therefore excluding small to very small discrepancies is a “brute force” fix. This trimming significantly decreases the number of anomalies detected.
This methodology leads to the following results:
And subsequently to the following theoretical P&L:
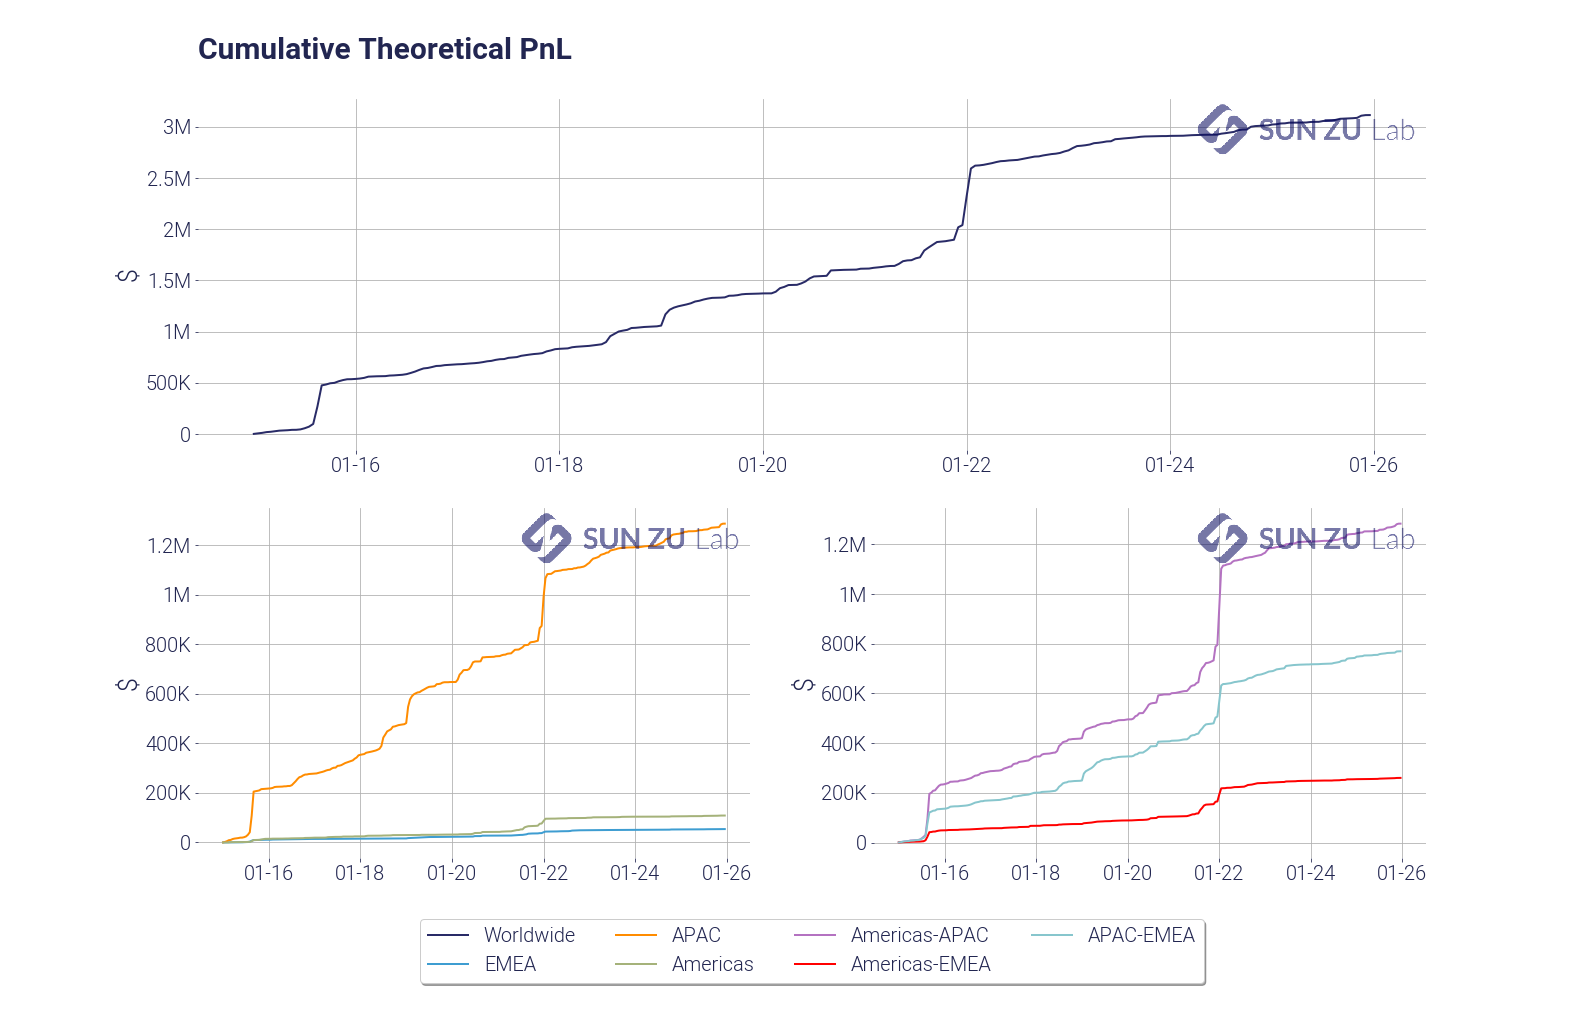
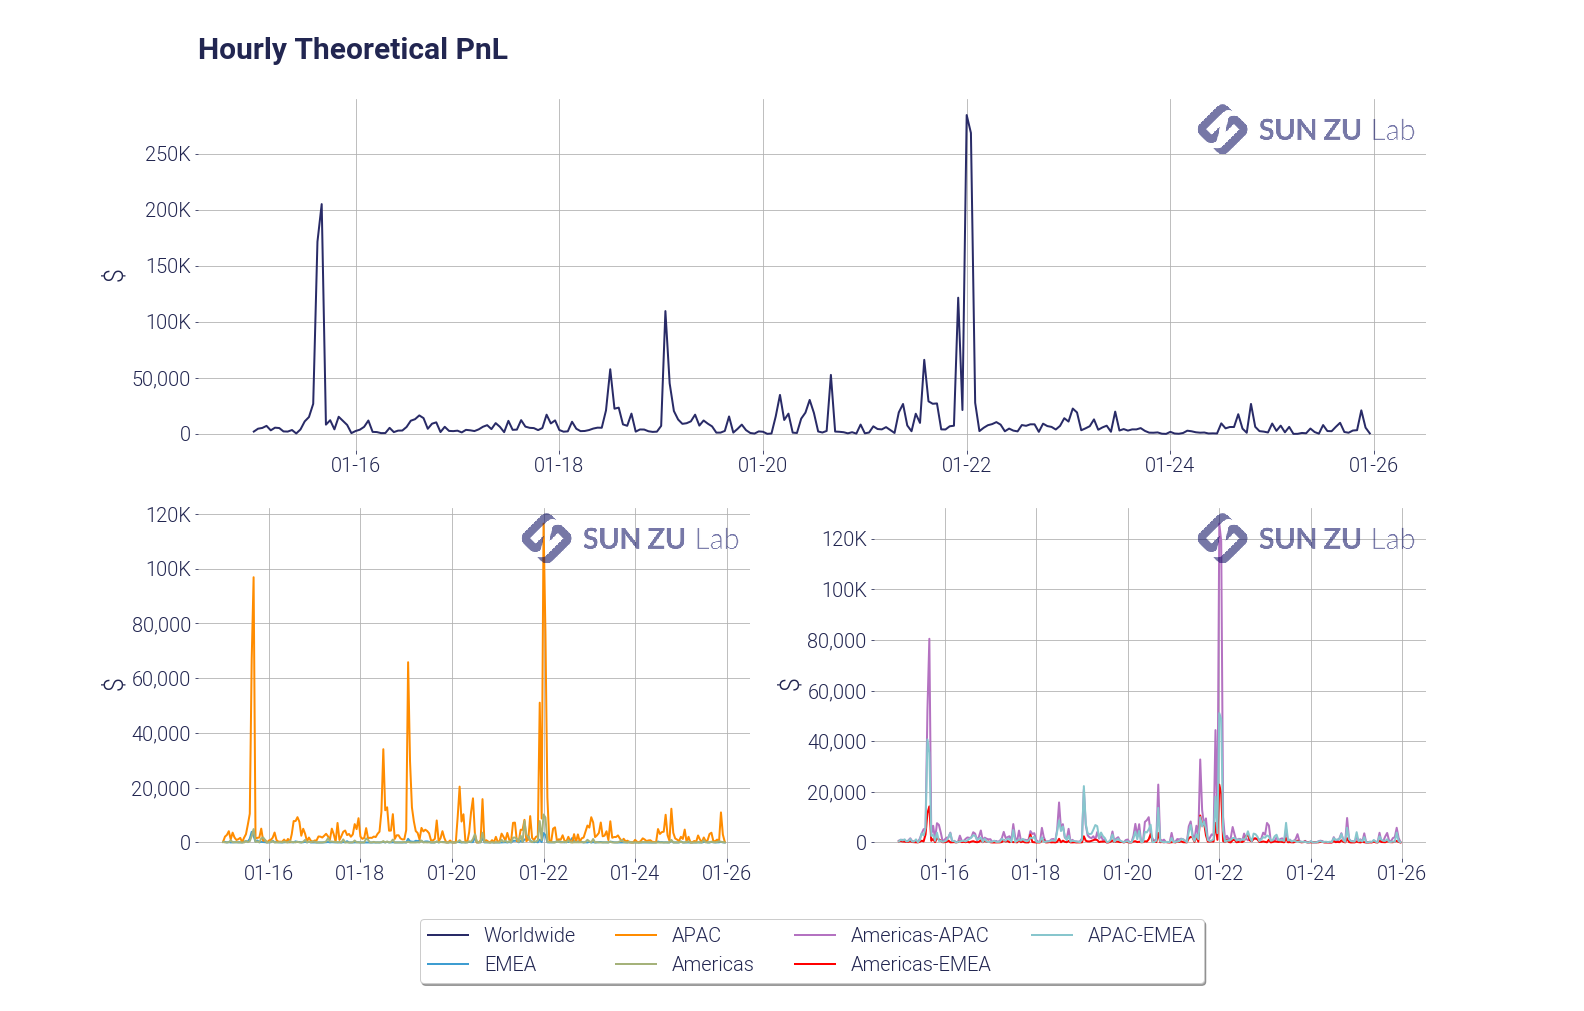
Overall, we believe our AI indicator is a reliable and significant measure of market integration, and we will produce a bi-monthly report incorporating the above results (and more!) for BTC as well as other digital assets. Investors seriously curious about cryptocurrencies and digital assets may find in this a way to monitor market efficiency as it evolves through time and across trading venues.
To register for a 30-day free trial on our research consult our web site or contact us. And by the way feedback and comments are always welcome!
Price discrepancies in the world of digital assets

What a strange market!
We at SUN ZU Lab are striving to gain a deep understanding of how the markets for digital assets function, to help our clients achieve their investment strategy through better execution. Based on our long (very long!) experience of traditional markets, we have started looking closely at liquidity and arbitrage. The interested reader will find a sample of our efforts here.
We subsequently turned our attention to the basic behavior of trading venues, trying to understand if there was something special there compared to what we knew of traditional well-established exchanges. Thus we started looking at small-scale data to try and detect unusual patterns. Because we aimed at being as systematic and unbiased as possible, we devised automated filters to isolate those events.
The result is our latest weekly “market anomalies” report, which presents events selected because of a sharp price movement or heavy volume. For each of those events, we look at price discrepancies and/or volume patterns. Well, the results are quite surprising, here are three examples abstracted from our report dated March 26th for bitcoin.
Price anomaly #1: -1.53% on 3/21/21 between 09:43 and 09:44 UTC
By looking at the most significant price movements over a 1-minute interval we can detect periods where markets are moving “fast”, and those moments are very good candidates to detect unusual price or volume patterns.
As an illustration, below is the 1-minute charts of BTC prices and volumes on 5 venues, between 9:43 and 9:44 on 3/21:


To get a better sense of price discrepancies, we chart the maximum price difference in the interval between the lower and higher price:
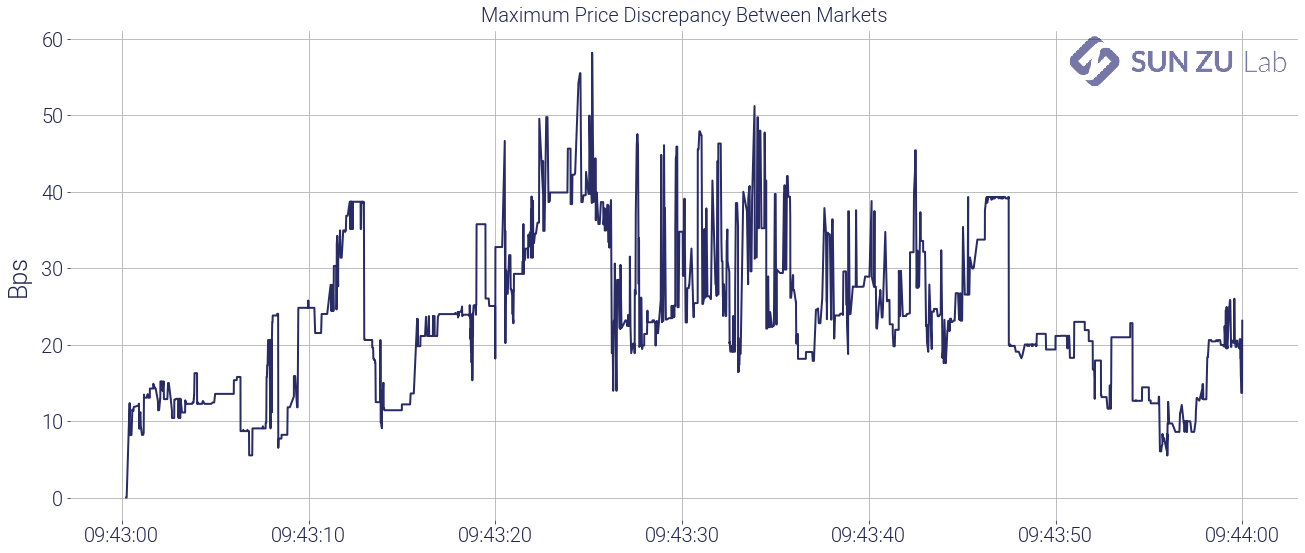
It is fairly clear that during this period, prices on the different venues were far from being “aligned”. In another of our reports, we look at price discrepancies and arbitrage opportunities at a macro scale, but here at the tick level, we suspect there are opportunities to be grabbed.
Or are there? Let’s have a closer look at the strangeness of this picture:
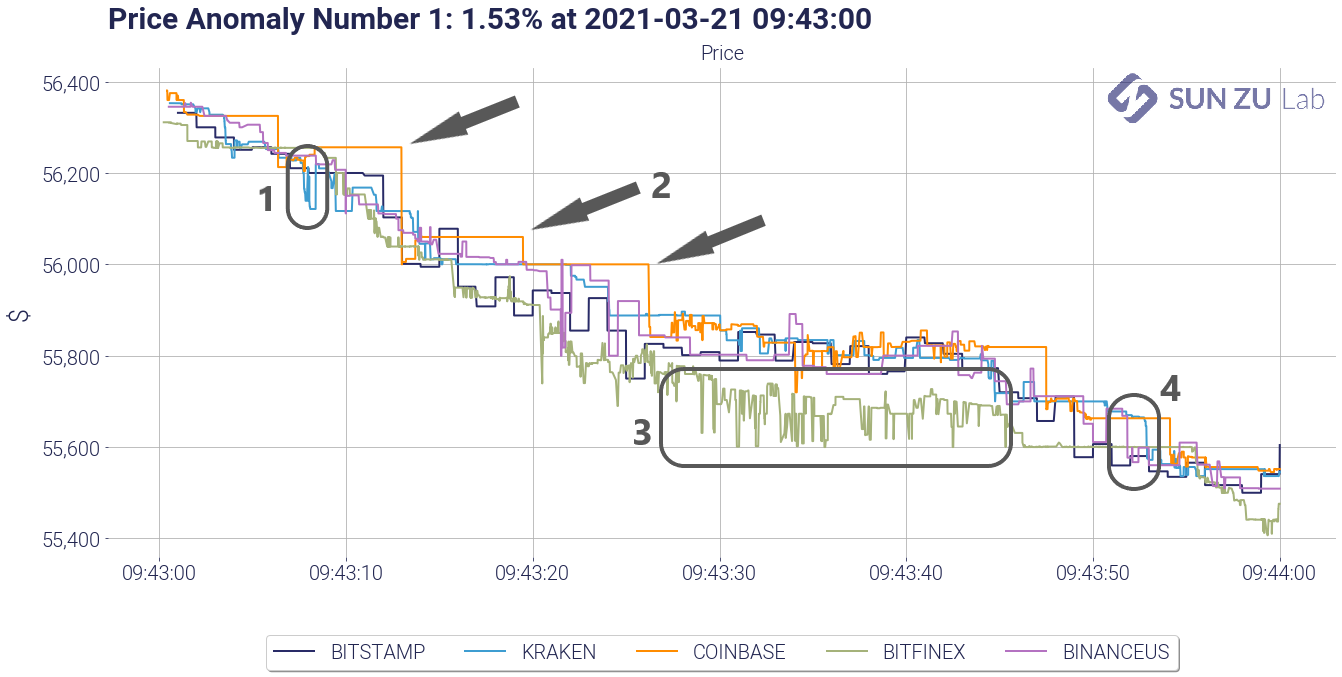
I have numbered 4 surprising patterns:
- a small blip of Kraken vs. other exchanges: what is happening on Kraken at that precise time? BTC is trading there several times $100 below other markets. What is unexpected is not the fact that one venue experiences sharp movements independently from the others. The surprising part is that none of the other venues moves in sync. We strongly suspect that there are many arbitragers out there sharpening their trading algorithms to specifically identify and exploit those situations. Why was there no change anywhere but on Kraken? One possible explanation is that there was not enough time to capture that opportunity. Well, this is unlikely because as it happens all venues traded repeatedly during a window that lasted several seconds. Another explanation is that bid/ask spreads were very wide and trades occurring on one side of the spread appeared to be out of sync. Investigating that idea requires tick-by-tick order book data, and a little bit of work (but do not worry we are on it). Another explanation could be that some of the trades on Kraken were fake trades, or that they happened outside the regular bid/ask spread if they were “pre-negotiated” (a particular status that indicates a block trade on traditional exchanges). In any case, we would need a little bit more information from the exchange to be able to conclude.
- Coinbase price seems to be lagging: as surprising as it looks, this type of pattern is quite straightforward to explain. It results from the lag in order book positioning on Coinbase. The bid/ask spreads on other exchanges adapts more rapidly, which means that prices tend to lag and adjust at the last moment (i.e. the next transaction) on Coinbase. Again confirming this initial intuition requires tick-by-tick order book data, but nothing worrying there.
- Bitfinex at $100 to $150 discount compared to other markets: well, that’s a big one. The discount on Bitfinex appears 20 seconds before but stays stubbornly high. It appears and doesn’t disappear for some time (see #2 anomaly below where it exists with the same magnitude). A discount like this would rarely appear on traditional markets (stocks, derivatives, bonds, etc) because market participants would arbitrage it away sooner rather than later. If it persists as it does here, it is not your typical liquidity discount. Indeed, it is associated with Bitfinex, other exchanges keep trading in sync (more or less). Therefore the underlying reason is to be found with the specifics of Bitfinex: are there trading constraints that would induce investors to severely discount BTC on that platform compared to another? Indeed our research confirms that this discount appears quite regularly, and never turns into a premium. Investors should therefore be mindful and investigate further the underlying reasons that could create a recurring anomaly like this (as will we!).
- $80 price difference between Kraken on one side and Bitstamp/Binance on the other: whereas Kraken was at the bottom before, it is now trading higher than the others. Coinbase is lagging, Bitfinex is still at a discount, but Bitstamp/Binance and Kraken repeatedly trade at a $100 difference for 6 to 7 seconds. Are those real arbitrage transactions or “visual effects” due to lagging or fake transactions? As before we need tick-by-tick order books to conclude, and possible further information from the exchanges if everything else proves insufficient.
For the sake of curiosity, below are two more anomalies abstracted from our report. The reader will find the Bitfinex discount again, and long, recurring inter-venue price discrepancies. NB: the last anomaly is one detected through our volume filters, hence labeled “volume anomaly”. Volumes on Bitfinex appear as extreme outliers, accompanied by price dips that have a very small impact on other venues.
Price anomaly #2: +1.11% on 3/21/21 between 09:44 and 09:45 UTC
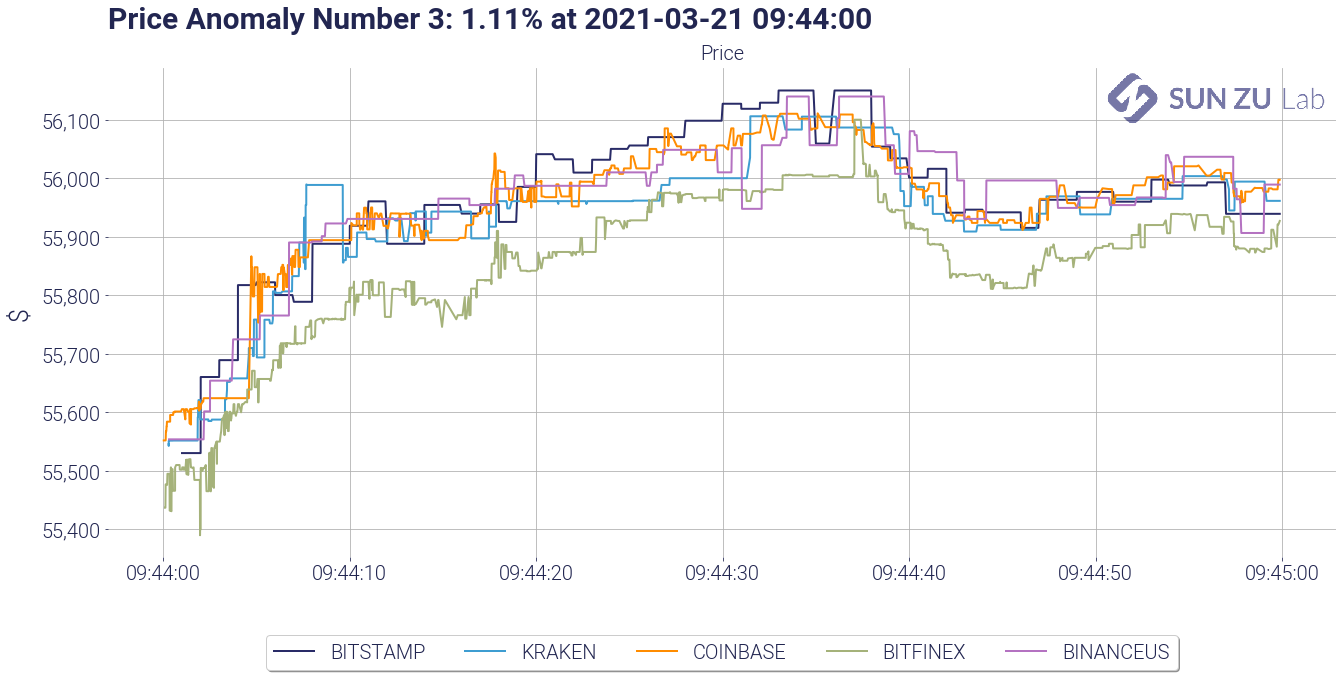
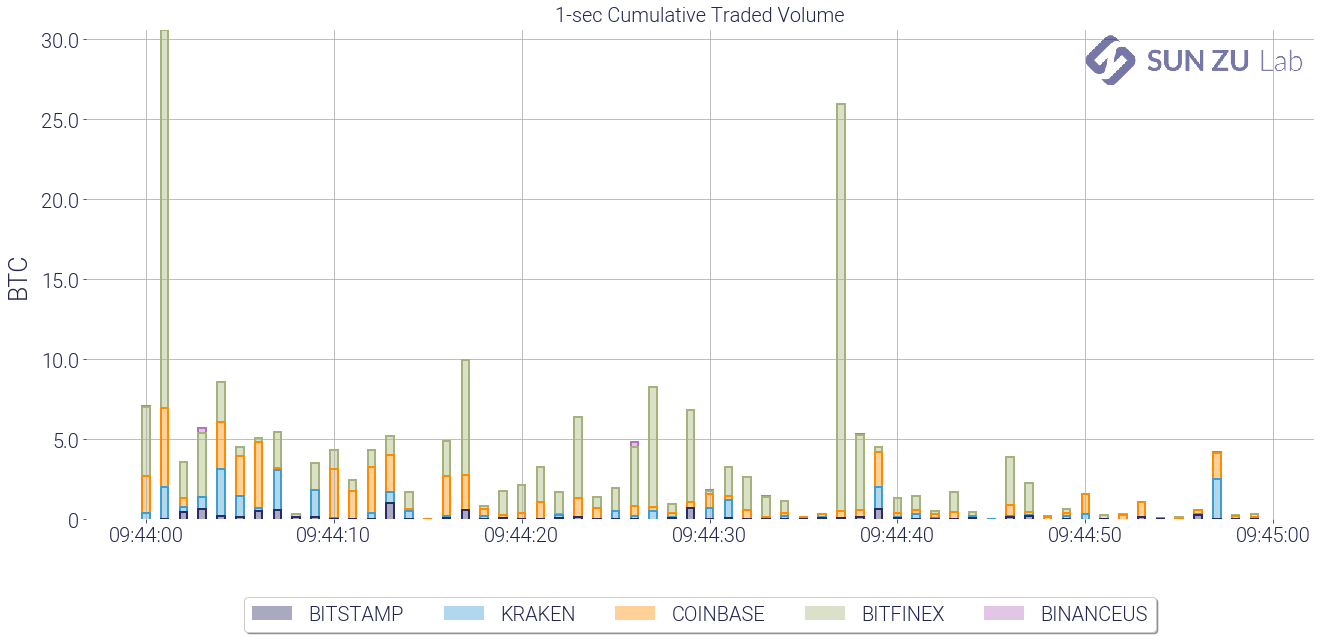
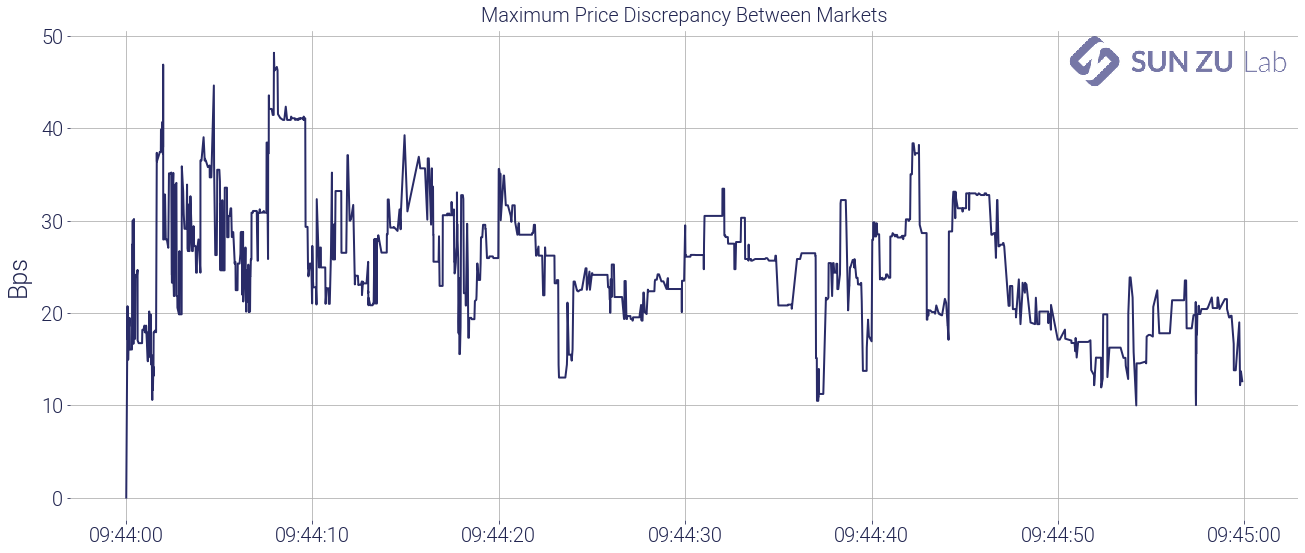
Volume anomaly #1: 706 BTC on 3/21/24 between 22:15 and 22:16

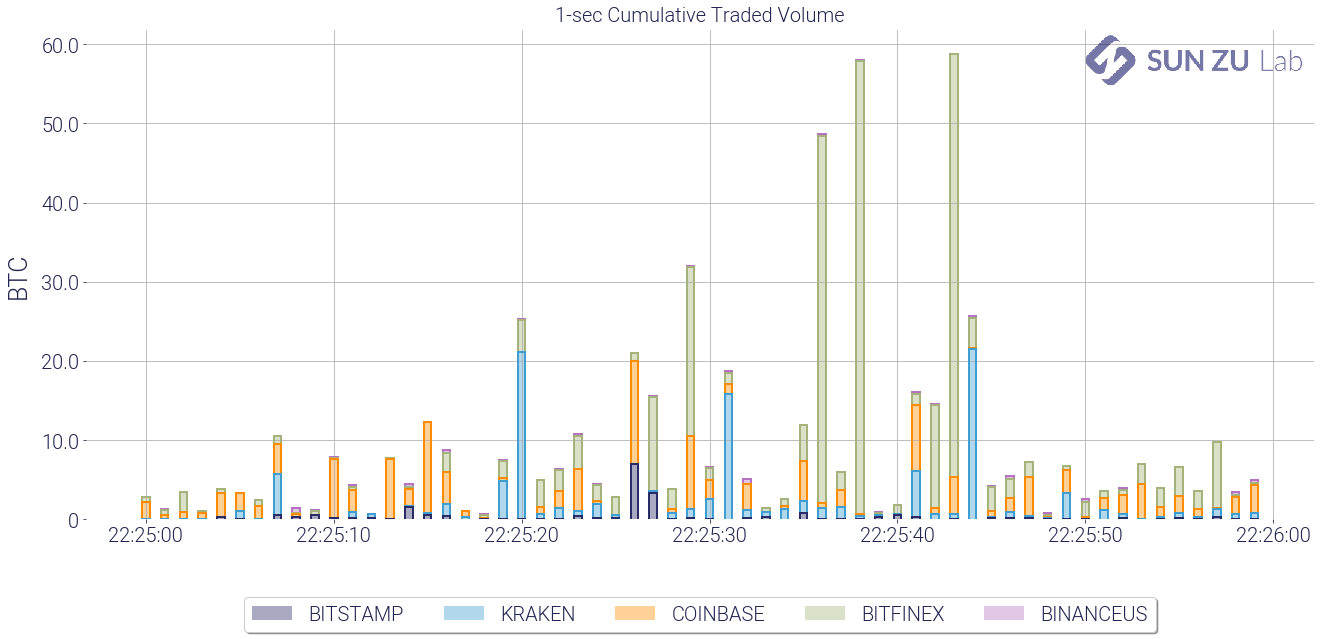
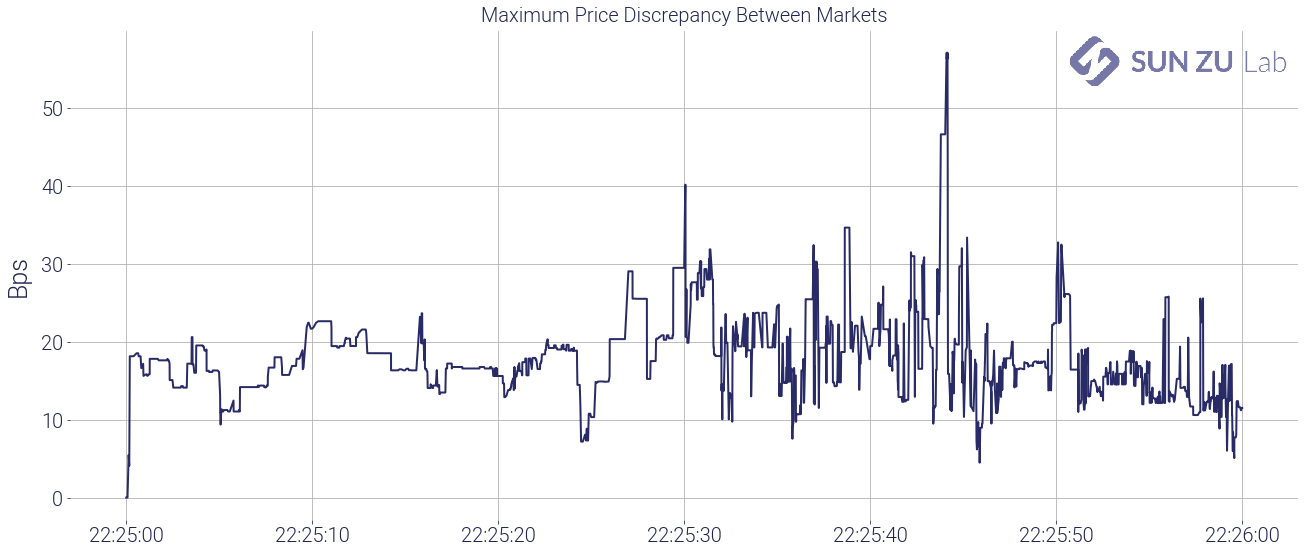
Well, we knew digital asset venues were not so closely integrated, but here we have a very detailed view of anomalies that are curious and result in significant price discrepancies. To track some of those anomalies regularly, we will produce a weekly report incorporating the above results (and more!) for BTC as well as other digital assets. Investors seriously curious about cryptocurrencies and digital assets may find in those a way to monitor market efficiency and as it evolves through time and across trading venues.
If you want to follow our research and efforts to shed light on all things related to the liquidity of digital assets, register for a 30-day free trial on our research, consult our website, or contact us. Feedback and comments are always welcome!