By Chadi El Adnani @SUN ZU Lab
November 2022

This article was part of a broader report on the following theme: “Challenges and opportunities: The future of DeFi in TradFi”. Crypto Valley Association selected it among the top 5 pieces for its 2022 Call For Papers challenge.
DeFi and DEXs have recently attracted much attention. Uniswap raised in October 2022 a $165 million Series B funding round that valued the company at $1.7 billion, and DEXs globally are profiting from the hit that confidence in CEXs suffered following the FTX fallout. We provide in this first article a general overview of DeFi, DEXs and DAOs, focusing on Uniswap V3. In the second part of this article, we will cover a more technical analysis of price discovery and on-chain/off-chain arbitrage opportunities.
Questions and comments can be addressed to c.eladnani@sunzulab.com or research@sunzulab.com.
1. General Overview
DeFi, an abbreviation for Decentralized Finance, refers to peer-to-peer finance enabled by Ethereum, Polkadot, Avalanche, Solana, Cardano and other layer-1 blockchain protocols. It is often depicted as the opposite of centralized finance (CeFi) or traditional finance (TradFi), where buyers and sellers rely on trusted intermediaries such as banks, brokers, custodians and clearing firms. While some trace DeFi’s origins back to bitcoin and Nakamoto’s invention of blockchain concepts, it mainly was the introduction of smart contracts by Ethereum that helped DeFi apps flourish in the following years.
There are some direct pros and cons that come out of this opposition. Due to blockchain technology characteristics and removing intermediaries, financial transactions are usually faster with lower costs using DeFi. On the other hand, the absence of centralized banks and custodians often means that DeFi app users need to ”self-custody” their assets in their wallets, with the risks and logistical difficulties that this may bring.
The proliferation of DeFi has also brought the concept of DAOs, or Decentralized Autonomous Organizations, into the central stage. DeFi apps are usually managed through a DAO, where the process of management decision-making is made by decentralized validator nodes who own or possess sufficient tokens to approve blocks.
Vitalik Buterin defined DAOs as entities with internal capital with automation in the centre and humans at the edges. In simpler terms, DAOs could be seen as multi-signature wallets (multi-sig), releasing funds based on predetermined voting thresholds. Several characteristics follow from this definition:
- The code and community of a DAO are decentralized. Just as a smart contract’s code resides in no country, so may anyone join a DAO regardless of personal domicile or legal standing.
- DAOs are autonomous both in their formation and execution. No authority external to the DAO is necessary for its creation or operations. This autonomy means no registration, incorporation, or filing are required. It also means no law enforcement, army, or courts are needed. Legal organizations do not possess this quality. They both exist and continue to live at the whim of the state. For a business to form, a nation must permit it, and it will exist only as long as that nation says it does.
- DAOs are pseudonymous; they require only an internet connection to join and participate. Once governments do not need to issue legal identities, pseudonymity becomes a fundamental property of DAOs. This property is impossible within existing legal categories, as business ownership is KYC’d and meditated by the state.
The above definitions put the DAO construct and existing legal categories at odds. Laws are nationspecific, and DAOs are nation-agnostic. Legal entities rest on the sovereignty of nation-states, while DAOs operate through the pure power of mathematics and cryptography. There exists, however, DAOs that are legally incorporated, but these are closer to organizations leveraging DAO tooling rather than pure DAOs.
The absence of a centralized authority characterizes DAOs; there is no executive management, a board of directors, or shareholders to satisfy. Instead, community members submit proposals to the group, and each node can vote on each proposal. The proposals supported by a certain percentage of voters (1/2, 2/3 or 3/4 depending on the structure) are passed and enforced by the rules coded into smart contracts.
DAO benefits could be summarised as follows:
- Automation and speed: decisions are made collectively through voting and enforced automatically via smart contracts. This eliminates the human factor and speeds up project development and improvement.
- Transparency and trustless aspect: DAOs retain and amplify these main blockchain benefits.
- Increased security: the minimization of human factor interference and blockchain technology make DAOs much more secure than traditional organizations.
- Community implication: collaborative work, distributed responsibility, and collective decisionmaking make DAOs one of the most sophisticated and well-organized forms of human interaction.
According to Coinmarketcap, the top 5 DAO projects by market capitalization are the following (as ofNovember 2022): Uniswap ($5.5bn), ApeCoin ($1.4bn), Aave ($1.2bn), BitDAO ($0.9bn), and Maker ($0.9bn). We notice a clear DeFi dominance over the DAO category.
2. Focus on DEXs – Deep dive into Uniswap v3
Decentralized Exchanges (DEXs) are a set of smart contracts that run on different blockchains and allow for decentralized swaps of selected tokens. DEXs popularity and usage have grown exponentially during the 2020 DeFi summer period, marked by the launch of Uniswap v2, allowing for ERC20 / ERC20 token swaps on Ethereum and the liquidity mining frenzy with the launch of governance tokens such as COMP or UNI. This was followed in 2021 by the release of Uniswap v3, which provided increased capital efficiency, improved the accuracy of price oracles and introduced a more flexible fee structure.
In 2021, Uniswap launched its v3. While this version used a constant function market maker model (CFMM), it came with significant enhancements to capital efficiency (up to 4000x relative to v2), a more flexible fee structure, and a more accurate price oracle. [tea21].
Liquidity providers (LPs) are able in v3 to concentrate their liquidity by allocating it to a specific arbitrary range. Individual positions are aggregated into a single pool, forming a combined curve against which users can trade. This improvement has paved the way for low-slippage trade execution, surpassing centralized exchanges and stablecoin-focused AMMs. Users can also add liquidity to a price range entirely above or below the market price to sell one asset for another, approximating a fee-earning limit order that executes along a smooth curve.
In previous versions, every pair of tokens corresponded to a single liquidity pool, which applied a standard fee of 0.30% to all swaps. This uniform fee structure was not optimal, being too low for some pools (such as high volatility or illiquid token pools) and too high for others (such as pools between two stablecoins).
This is why Uniswap v3 introduced multiple pools for each pair of tokens, each with a different swap fee: 0.05%, 0.30% or 1%. Due to this new non-fungible nature of positions, fees earned are no longer continuously deposited in the pool as liquidity as before. Instead, fee earnings are stored separately in the form of the tokens in which they are paid.
Uniswap v3 is governed like the previous versions by UNI tokenholders, but it is more flexible regarding the fraction of swap fees that go to the protocol. Users can choose for each pool any fraction 1/N for N ranging from 4 to 10, or 0. UNI governance can also add fee tiers beyond the initial tiers of 0.05%, 0.10% and 0.30%.
Finally, users can transfer ownership to another address.
Uniswap v3 comes with three main changes to the time-weighted average price (TWAP) oracle that Uniswap v2 introduced. First, v3 removes the need for users of the oracle to track previous values of the accumulator externally, bringing the accumulator checkpoints into the core. Thus, v3 allows external contracts to compute on-chain TWAPs over recent periods without storing checkpoints of the accumulator value.
Second, Uniswap v3 tracks the sum of log prices instead of accumulating the sum of prices, allowing users to compute the geometric mean TWAP instead of the arithmetic mean TWAP. This change avoids the need to track separate accumulators for price ratios between tok1 and tok2. Indeed, the geometric mean of a set of ratios is the reciprocal of the geometric mean of their reciprocals. Finally, Uniswap v3 adds a liquidity accumulator that it tracks parrallel to the price accumulator, which accumulates 1/L for each second.
This liquidity accumulator is helpful for external contracts that want to implement liquidity mining on top of Uniswap v3. Although these enhancements to Uniswap v3’s TWAP oracle are encouraging, research was published suggesting that TWAP oracles are unsuitable for the vast majority of DeFi use cases compared to Chainlink’s volume weighted average price (VWAP) oracles. The main differences between these two systems can be summarised as follows:
- Price precision: VWAP price feeds deliver accurate, real-time data regardless of the market state. On the other hand, TWAP oracles are lagging indicators that become outdated during moderate to high volatility, feeding smart contracts inaccurate data.
- Security/accuracy optimization: TWAP oracles force users to optimize between security and accuracy but do not offer the opportunity to achieve both simultaneously, as with Chainlink VWAP oracles.
- Market coverage: Chainlink price feeds provide total market coverage by tracking prices on all exchanges (CEXs & DEXs) and weighting them by actual volume. This is a significant advantage to TWAP oracles that only track prices from a single exchange.
- Scaling security: TWAP oracles severely lack scalability in terms of security, as the only methods of increasing security are either incredibly capital intensive or result in inaccurate data during volatility. Chainlink oracles have a competitive advantage on this front, providing numerous ways to increase security, such as adding more nodes or data sources.
- Feed diversity: Unlike Chainlink oracles, TWAP oracles only provide the exchange ratio between two on-chain tokens and cannot provide financial market data on real-world assets like commodities, forex, stocks or indices.
For all the reasons stated above, TWAP oracles remain unsuitable for the vast majority of DeFi applications that secure user funds, compared to Chainlink’s VWAP oracles that provide DeFi with higher quality price data.
3. The dominance of Uniswap v3
In less than a year, Uniswap v3 has gained significant dominance over other DEXs and even CEXs. Some factors that could explain this meteoric rise include the composability enabled by AMMs with other DeFi protocols and the ability to trade without asset custody by intermediaries.
Another factor that gained in strength over 2022 is simply Uniswap’s ability to provide higher liquidity levels than larger centralized exchanges. The Uniswap team shows in an analysis titled ”The dominance of Uniswap v3 liquidity” that, compared to other larger CEXs, Uniswap v3 has around two times higher market depth on average for spot ETH-USD pairs (using the most liquid dollar or stablecoin on each platform for comparison).
Market depth in traditional limit order books is computed by adding the limit order amount at each price level. As there are no limit order books in AMMs, the Uniswap team provides a methodology to derive an equivalent market depth using liquidity distribution over a price range (detailed methodology available in the original document).
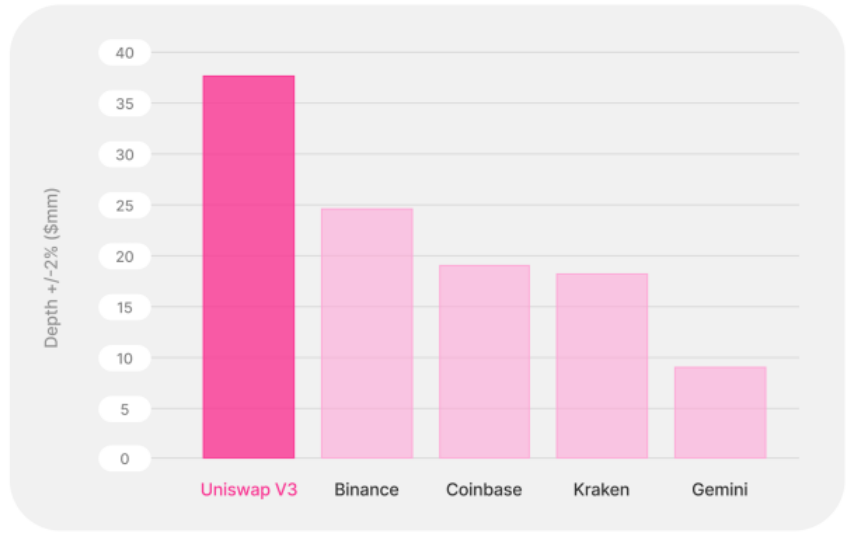
Daily average +/- 2% spot market depth in $ millions for the sample period from June 1, 2021 to March 1, 2022.
The comparison uses the most liquid ETH/USD pair for each of these markets
(ETH/USDC on Uniswap v3, ETH/USDT on Binance, ETH/USD on Coinbase, and ETH/USD on Gemini)
Source: the dominance of Uniswap v3 liquidity [LR22]
The analysis further shows that Uniswap v3 has had significantly higher market depth throughout the
sample period compared to CEXs in spot trading, as can be seen in the following graph:
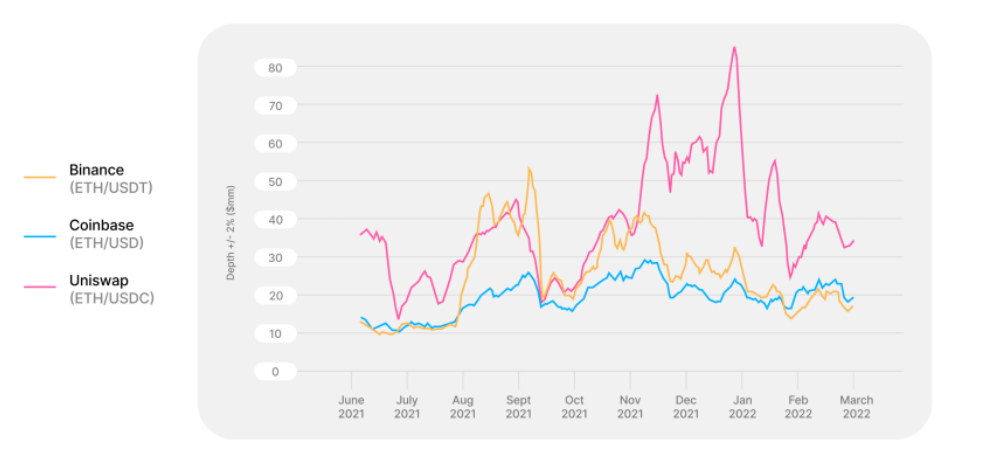
(ETH/USDT), and Coinbase (ETH/USD)
Source: the dominance of Uniswap v3 liquidity [LR22]
Additionally, Uniswap v3 displays higher market depth levels across all price levels, making it more advantageous to choose Uniswap v3 for larger trades relative to CEXs:
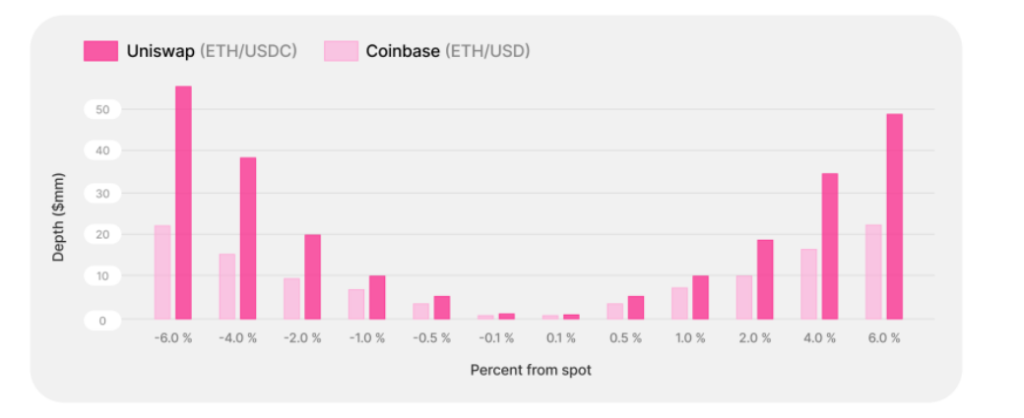
from June 1, 2021 to March 1, 2022.
Source: the dominance of Uniswap v3 liquidity [LR22]
It is important to note that the above analysis does not consider transaction costs, including gas costs on Ethereum, fees, or unexpected pre-trade slippage. The Uniswap team advances that these costs are broadly comparable for Uniswap v3 and CEXs, and are small relative to costs associated with market depths for large trade sizes.
Fee tiers on Uniswap v3 range from 1 bps, famous for stablecoin-only pairs, to 100 bps for the most volatile long-tail assets. Fees on Coinbase Pro, for example, range from 5 bps to 60 bps depending on the monthly transaction volume. CEXs have bid/ask spreads that vary based on the market and time. On the other hand, network congestion determines gas costs for on-chain transactions through AMMs. Since its
inception, the Uniswap v3 team computes a $31 median cost of a swap transaction.
The benefits of trading on a more liquid market are directly visible. Trading an ETH/dollar pair on Uniswap v3 would roughly generate a 3.8 bps price impact on average, against a 5 bps average price impact in Coinbase Pro, saving 1.3 bps of the notional (0.6 bps net of gas cost). The savings are even more significant for larger trade sizes. For a trade size of $5 million, the savings would be around 0.5% of the notional given the expected price impact difference. A ETH/dollar trade executed on Coinbase Pro that results in an average price impact of 0.05% (corresponding to a notional size of $650,000 at 0.1% market depth, assuming linear scaling of price impact with notional) would only have an average price impact of 0.0375% on Uniswap v3.
This is equivalent to around $81 on the price impact and around $36 of saving net of gas and fees. The weighted average of fee tiers is around 20 bps for Uniswap v3, the same as Coinbase Pro for the 650k – 1m volume tier. For $5 million notional, the average price impact is roughly 0.5% on Uniswap v3 and 1% on Coinbase. The fee is about 2 bps lower on Coinbase.
In addition to this analysis, data from Chainalysis in its latest web3 report showed that DEXs had dethroned CEXs in terms of on-chain transaction volumes for the first time in 2021. Indeed, while most CEX transactions happen off-chain on centralized databases and are captured on their order books to save on transaction fees, every DEX transaction occurs on-chain through smart contracts.
This helps explain how DEXs are leading in on-chain transaction volume. From April 2021 to April 2022, $175 billion was sent on-chain to CEXs, well below the $224 billion sent to DEXs.
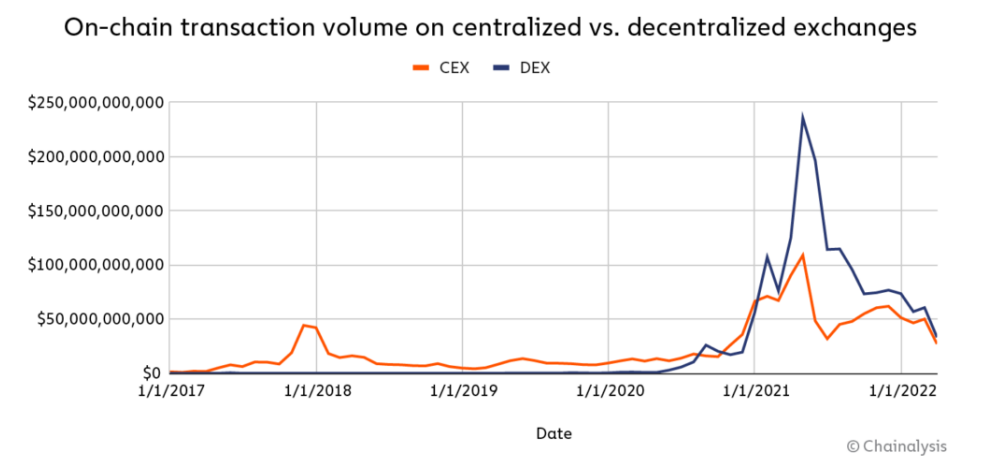
Source: Chainalysis June 2022 web3 report
It is crucial, however, to put things back into perspective. The following graph, although a bit outdated (global cryptocurrency market capitalization is around $1 trillion as of November 2022, according to Coinmarketcap), gives a precise idea of the scale of DeFi and crypto markets compared to more traditional and mature stock, real estate or derivatives markets.
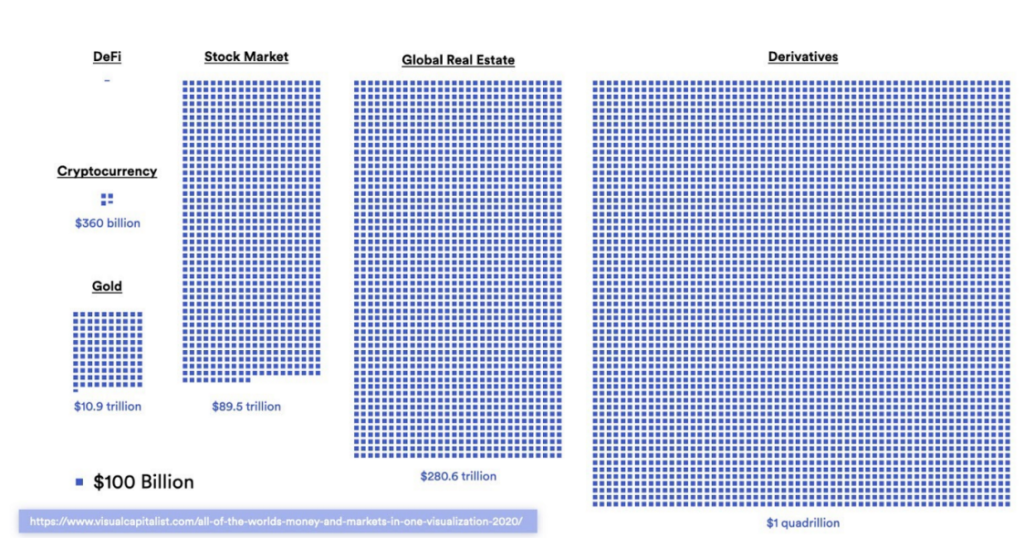
Source: SmartContent
The following picture helps to better grasp what $100 billion represents in terms of value.
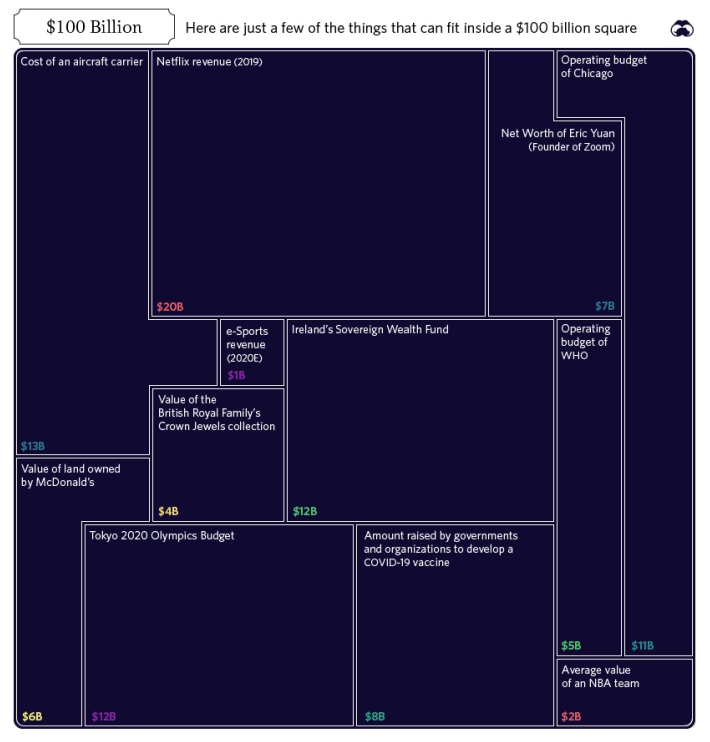
Source: Markets Insider
Do you want to go further? Read our quantitative analysis here!
We would be happy to hear your thoughts about DeFi in crypto markets!
Questions and comments can be addressed to: research@sunzulab.com
References:
- [tea21] Uniswap team. “Uniswap v3 Core”. In: (2021). url: https://uniswap.org/whitepaper-v3.pdf.
- [LR22] Gordon Liao and Dan Robinson. “The Dominance of Uniswap v3 Liquidity”. In: (2022).
Disclaimer:
No Investment Advice
The contents of this document are for informational purposes only and do not constitute an offer or solicitation to invest in units of a fund. They do not constitute investment advice or a proposal for financial advisory services and are subject to correction and modification. They do not constitute trading advice or any advice about cryptocurrencies or digital assets. SUN ZU Lab does not recommend that any cryptocurrency should be bought, sold, or held by you. You are strongly advised to conduct due diligence and consult your financial advisor before making investment decisions.
Accuracy of Information
SUN ZU Lab will strive to ensure the accuracy of the information in this report, although it will not hold any responsibility for any missing or wrong information. SUN ZU Lab provides all information in this report and on its website. You understand that you are using any information available here at your own risk.
Non Endorsement
The appearance of third-party advertisements and hyperlinks in this report or on SUN ZU Lab’s website does not constitute an endorsement, guarantee, warranty, or recommendation by SUN ZU Lab. You are advised to conduct your due diligence before using any third-party services.
About SUN ZU Lab
SUN ZU Lab is a leading data solutions provider based in Paris, on a mission to bring transparency to the global crypto ecosystem through independent quantitative analyses. We collect the most granular market data from major liquidity venues, analyze it, and deliver our solutions through real-time dashboard & API stream or customized reporting. SUN ZU Lab provides crypto professionals with actionable data to monitor the market and optimize investment decisions.