By Chadi El Adnani, Crypto Research Analyst @SUN ZU Lab
All seasoned investors know this for a fact: the first and foremost characteristic of a financial instrument is its liquidity. In its 4 th annual global crypto hedge fund report published recently, PWC confirmed that liquidity is indeed the most common consideration for crypto funds when choosing a trading venue (cited by 39% of respondents, see below). This percentage is significant and far above the next consideration, trading opportunities, at 18%. In the wake of this finding, we felt an overview of market liquidity with a focus on crypto markets was a good idea. Too often is the concept of liquidity overlooked or taken for granted, whereas in real life it is not only critical but difficult to quantify or elicit. In this article we provide general foundations about what liquidity is, its variations and manifestations
What are the most common considerations for crypto funds when choosing a trading venue?
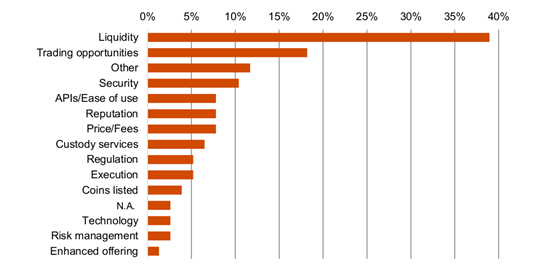
Source: PWC 4 th annual global crypto hedge fund report 2022
What is liquidity ?
We focus in this article on market liquidity, which is a different concept from monetary liquidity: a company’s ability to meet its current liability commitments. Liquidity is defined as the ability to buy or sell large quantities of an asset without significant adverse price movement. It is an important factor that investors need to assess before executing their trades, since it is a clear constraint on how quickly they can gain access to the market and subsequently how fast they can lock in a profit from a particular asset.
There exists different types of market liquidity:
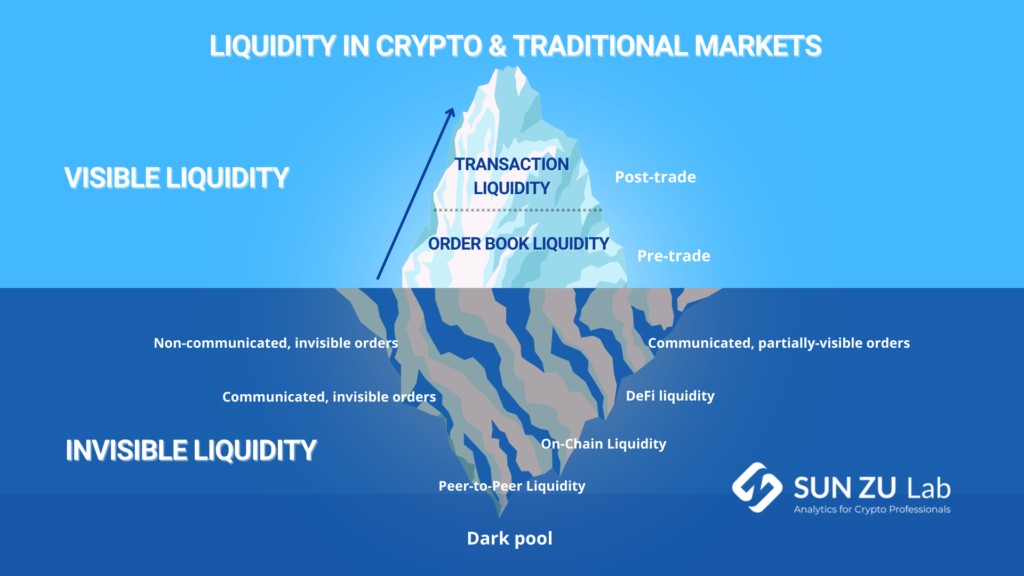
We identify at SUN ZU Lab three different types of market liquidity: transaction liquidity (post-trade), order book liquidity (pre-trade) and invisible liquidity. Those notions are additive, in the sense that all three exist at the same time for a given instrument. Yet there is a timing dependency between them: invisible liquidity needs to become visible (pre-trade) before it can be consumed (post-trade).
Derivatives markets, whether in crypto or TradFi, enjoy far more liquidity than spot markets. The Bitcoin futures market, for example, saw average monthly turnover of $2 trillion at its peak, a far greater figure than BTC spot markets’ volumes. Liquidity is not only variable in time, it is also distributed in space across multiple venues. Our data shows for example that BTC trading volumes are fragmented across exchanges, as seen in the graph below (limited to 5 exchanges, and in reality there are many more creating an even higher degree of fragmentation).
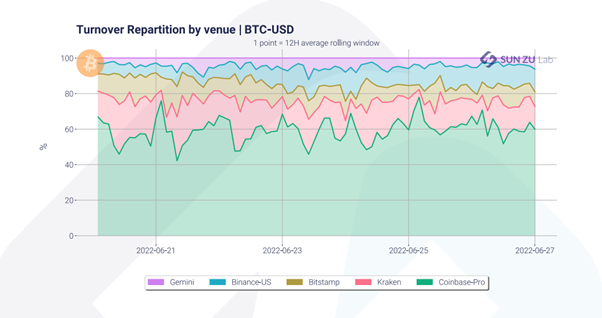
Source: SUN ZU Lab data
Transaction liquidity:
Transaction liquidity refers to liquidity that has been expressed through actual trading volumes. This is an important indicator as high trading volumes usually imply less difficulty to buy or sell large quantities. Among the most liquid markets we can cite the forex market, thought to be the most liquid in the world as major currency pairs are traded by governments, banks, and even individuals. The stocks and commodities markets are very liquid as well, although intuitively no large cap or bond will ever be as liquid as a national currency.
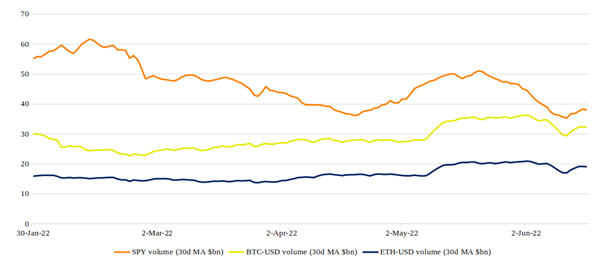
Source: data from Yahoo Finance
In the graph above, we show daily trading volumes in 2022 for the S&P 500’s most liquid ETF, Spider SPY, as well as BTC-USD and ETH-USD. The S&P 500 ETF is one of the most liquid instruments in the world, with $30 to $60 billion traded every day. Data shows that Bitcoin and Ether’s daily trading volumes vary in range between $10 and $40 billion.
These figures however need to be taken with a grain of salt due to various sources reporting that officially announced crypto trading volumes are greatly overestimated with the magnitude of fake volumes varying over time.
Order book liquidity (pre-trade):
Order book liquidity represents the total nominal (price * quantity) visibly offered across all available trading venues. This liquidity materialises as different buy/sell quantities sent by investors at different prices. Across all buy orders, the best price is referred to as “best bid”, and the “best offer” on the other side across selling orders. The mid price is quite logically the middle of those two.
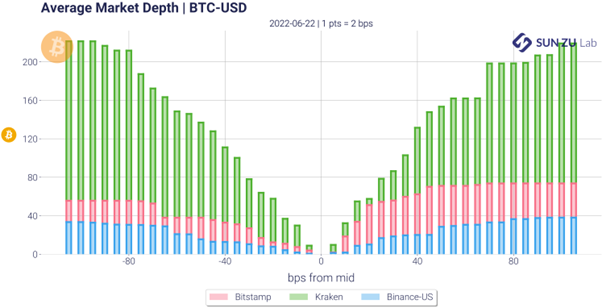
A visible order book represents the underlying supply and demand of an asset in the form of individual bid and ask orders. To illustrate this, here is a chart compiled by SUN ZU Lab showing how average liquidity aggregates around mid-price for BTC-USD on three main exchanges: Bitstamp, Kraken and Binance-US on the 22 nd of June, 2022.
Source: SUN ZU Lab data
The chart reads as follows: each bar represents the average quantity of BTC (in number of BTC) offered for buy/sell orders. For example, there were on average 200 BTC offered for sale at 80bps from mid-price on the three exchanges against around 210 BTC bid offers at -80bps from the mid-price.
Order books communicate information about investors expectations and appetite. In particular there appears a new concept to qualify liquidity: the bid-ask spread, which is the difference between the highest price a buyer is willing to pay for an asset and the lowest price a seller is willing to accept. The magnitude of this spread gives a good indication about an asset’s liquidity. For example a large spread indicate poor offer and/or demand, and incidentally may drive the volatility higher. Conversely a narrow spread is an indication of a deeper market where investor’s interest is high, and volume potentially abundant for buyers and sellers to execute their trades. Bid-ask spreads for Bitcoin, for example, used to be higher than 10% in the early days of crypto, but they have dropped massively to as low as 10bps on the main exchanges as crypto adoption, investor interest and trading volumes increased over time.
Invisible liquidity:
We refer to invisible liquidity as all forms of liquidity that is not captured in public trades or order books. Note for example that liquidity exposed to a limited set of investors would qualify here as invisible liquidity (more on this below).
In general terms, the taxonomy of “invisible liquidity” is extremely difficult to establish as it depends on the structure of the market. In markets where OTC activity is high, those trades and the interaction of brokers with their client are compartments of invisible liquidity.
One could argue that those compartments divert liquidity away from other pools, yet not all investors have access to it. In markets where OTC is not developed, those liquidity pools simply do not exist.
In the world of crypto, we distinguish the following categories:
● Non-communicated, invisible orders: quantities available for trading that are yet to be communicated by investors to the markets. There is virtually no way to quantify these volumes as they only exist in a theoretical state in strategy books of portfolio managers.
● Communicated, invisible orders: we put in this category for example trading activity of dark pools, also known as Alternative Trading Systems (ATS). These are private marketplaces where investors place buy and sell orders, without the venue disclosing available prices or volumes. Liquidity has found its way to the marketplace, it is just not visible (by anybody).
● Communicated, partially-visible orders: quantities available for purchase or sale, expressed through an Indication of Interest (IOI), which refers to an investor’s non-binding interest in a security, usually communicated to a broker. In traditional markets, IOI are heavily regulated because, depending on applicable rules, they constitute visible or invisible liquidity. The regulators’ particular interest on this
compartment stems from the fact that liquidity visible only by a few agents is easily manipulable.
● DeFi liquidity: this is liquidity placed on decentralized exchanges (DEXs) without being incorporated into order books. We will dive more in detail into how liquidity pools in DEXs work in another article.
● On-Chain Liquidity: centralized exchanges (CEXs) rely on the “order book” mechanism to enable off-chain transactions: aggregate positions are “written” on chain only when investors transfer their positions out of exchanges (and de facto reclaim ownership of those on their wallets). Pure on-chain transactions today account for a relatively small percentage of total volumes. Decentralized exchanges (DEXs) are another form of on-chain liquidity, that relies on smart contracts to execute trades automatically, recorded directly (and immediately) on blockchains.
Data from Chainalysis shows that DEXs have surpassed CEXs in terms of on-chain transaction volume in January 2021, with a $175 billion volume sent on-chain to CEXs from April 2021 to April 2022, vs. a $224 billion volume sent to DEXs during the same period.
● Peer-to-Peer Liquidity: P2P is a type of crypto exchange trading that allows traders to trade directly with one another without the need for a centralized third party to facilitate the transactions. This method allows exchanging parties to select a preferred offer and trade directly without using an automated engine to execute transactions.
Liquidity risks
The main liquidity risk associated to markets is for investors not to be able to enter/exit their positions due to a lack of sellers/buyers offering a fair price. One of the markets where this type of risk is the most visible is the real estate market. During times of economic turmoil or bad real estate market conditions, it could become impossible to find a buyer at the right price even though the property may have obvious value. A perfect example for this is the experience of NBA superstar Michael Jordan in trying to sell his Chicago mansion that has been on the market for 10 years already! The over-equipped luxurious house was originally listed for $29 million, before the owner was obliged to cut the price nearly in half overtime to try and match market expectations.
There is also another psychological effect that comes into play with illiquidity; the longer an asset is listed for sale, the more potential buyers are keen to second-guess their decision as the lack of interest and competition over the asset drives its value lower.
All of this has been extensively studied in traditional finance, and has become known as the “liquidity premium”: there is a clear relationship between price and liquidity. The higher the liquidity, the higher the price. This is the reason why real-estate prices are often subject to discount when economic conditions are under stress. We provide links to research articles about this subject in the appendix.
Conclusion
Liquidity is one of the most important concepts for individuals, institutional investors as well as exchanges and market makers. Despite holding high-value assets, any of these entities may experience a liquidity crunch if such assets cannot be sold within a short period. This is turn create heavy pressure on prices.
Top crypto projects’ tokens such as BTC, ETH, BNB or SOL appear to have reached a reasonable level of liquidity, but this is not the case for the vast majority of tokens that are only listed on one or two exchanges, with very low daily trading volumes and market depths. Above all, liquidity of the entire crypto market is still nowhere near liquidity levels visible in traditional markets.
Questions and comments can be addressed to c.eladnani@sunzulab.com or research@sunzulab.com
Appendix:
- Chainalysis June 2022 report
- “Liquidity and Asset Prices” by Amihud, Mendelson and Pedersen
- “The relationship between stock price and liquidity” by Murphy Lee
- “Measuring Liquidity Premiums for Illiquid Assets” by Anson
About SUN ZU Lab
SUN ZU Lab is a leading independent provider of liquidity analysis for investors already active or crypto-curious. We provide quantitative research on the liquidity of all digital assets to help investors improve their execution strategies and source the highest level of liquidity at the lowest cost.
Our product line includes research reports, software tools, and bespoke developments to fulfil the needs of the most demanding digital investor.

