A more systematic approach to liquidity monitoring
We at SUN ZU Lab have a deep curiosity about digital assets. Like everyone else, we follow bitcoin’s saga, with a volatility which, after all, is probably regarded more as a source or opportunity than a risk to be curtailed.
As we have written before (here and here), if digital assets were to constitute only a new source of liquidity, they would be an invaluable development in modern finance. Whoever has spent time on capital markets knows that liquidity is an elusive target at best. After decades of electronic trading, intense innovation, and regulatory adjustments, attracting and retaining liquidity remains as difficult as ever. Exchanges and trading venues worldwide know it firsthand, their primary responsibility is indeed to attract liquidity, one way or the other. Many have adopted “market-making” schemes whereby they basically waive fees and sometimes actually pay for participants to contribute orders in their central order book.
Liquidity is defined as the ability to rapidly buy and sell a product for significant size without adverse impact on its price. Note that this definition is not limited to financial products. Real estate for example is a very illiquid asset class. There is a constant trade-off between the time it takes to conclude a transaction and price improvements each party is willing to concede.
Liquidity is a very desirable feature on any developing market, and digital assets are no exception. If the price of bitcoin catches the front news almost every day now, reported trading volumes are also a big part of the story. Taken at face value, those suggest that bitcoin is at least as liquid as some of the most heavily traded traditional instruments (see here and here for a more detailed analysis on the subject).
Even though this is most certainly not true, in great part because volumes are massively manipulated (an x10 factor is commonly hypothesized), the bottom line is that public attention for bitcoin and more generally digital assets is bound to translate into more and more trading activity i.e. more liquidity. In fact, most of it may not even be visible: as investors stand by for the right price to buy or sell, they do not necessarily register their interest with a broker or on the order book of an exchange.
Where is liquidity to be found? There are dozens of venues, on-chain, off-chain, centralized, decentralized. Which venue should you turn to to find the most liquid market? Should you trade on several markets, if so which ones? What price and/or size can you expect if you include 1, 5, 15 markets in your shopping list?
Those are fundamental questions for investors, retail and professional alike. The marketplace is evolving so quickly and in so many different places that it is virtually impossible to follow all relevant developments. That’s where we at SUN ZU Lab, want to help. We started out with a mission: promote a truly institutional standard in the analysis of digital asset liquidity. Our quantitative research is meant to offer a dissected view of liquidity in time and space, so interested parties can get a sense of macro and micro trends to make better-informed decisions for their trading flow.
We had to start somewhere, so we decided to launch our product on BTC, including for the time being 3 markets: Coinbase, Kraken, and Bitstamp. We will be producing 3 reports: one on liquidity, another one will look at market integration (i.e. the existence of price discrepancies between different venues), and the third at what we call market anomalies (i.e. events for which price or volume is an outlier). [Register for our newsletter if you want to hear from us and receive a free sample!]
Let’s look here at the liquidity report. It is a quantitative dissection at liquidity over a 2 week period and will be produced twice a month. Our intention is to present rigorous information to qualify and quantify liquidity dynamics both intraday and over the observed period.
Here is the list of indicators we look at, abstracted from the report over the last 2 weeks in January:
- price and volume-at-price:
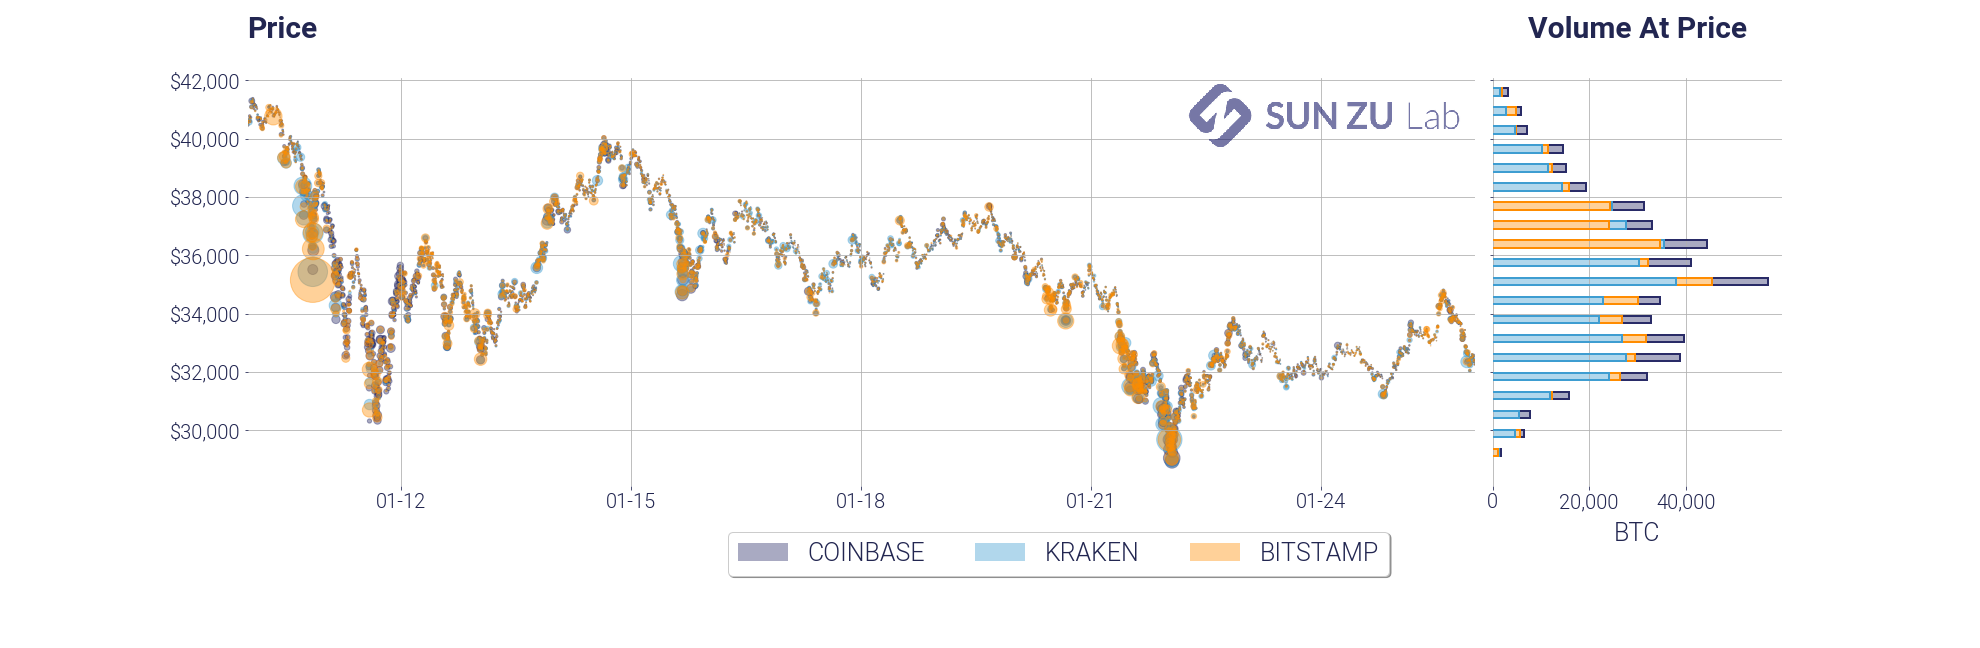
This chart is a necessary introduction, we absolutely need to have a sense of how the market has moved over the period, and at what price points have traders concentrated their activity. The volume-at-price add-on on the right side is an elegant way to present this information.
- traded volume, overall and by venue (daily and intraday):
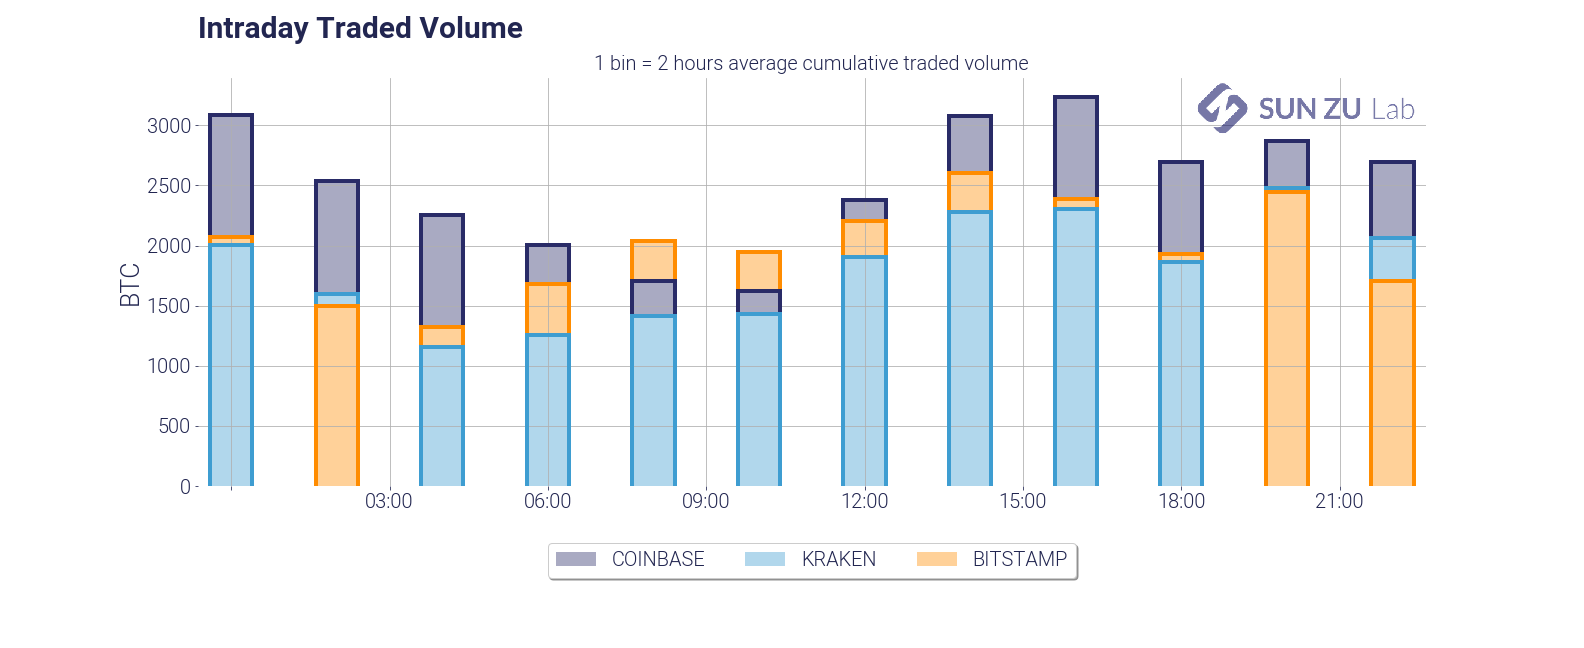
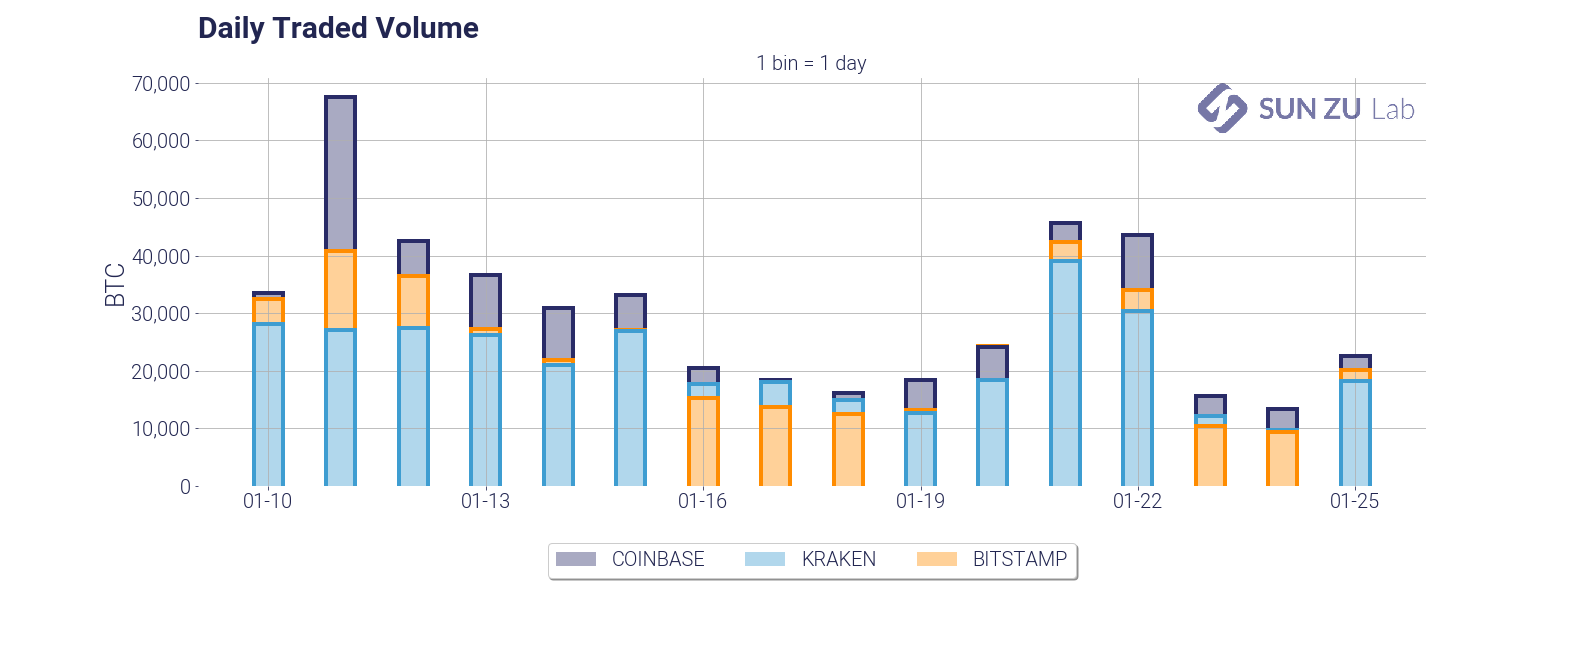
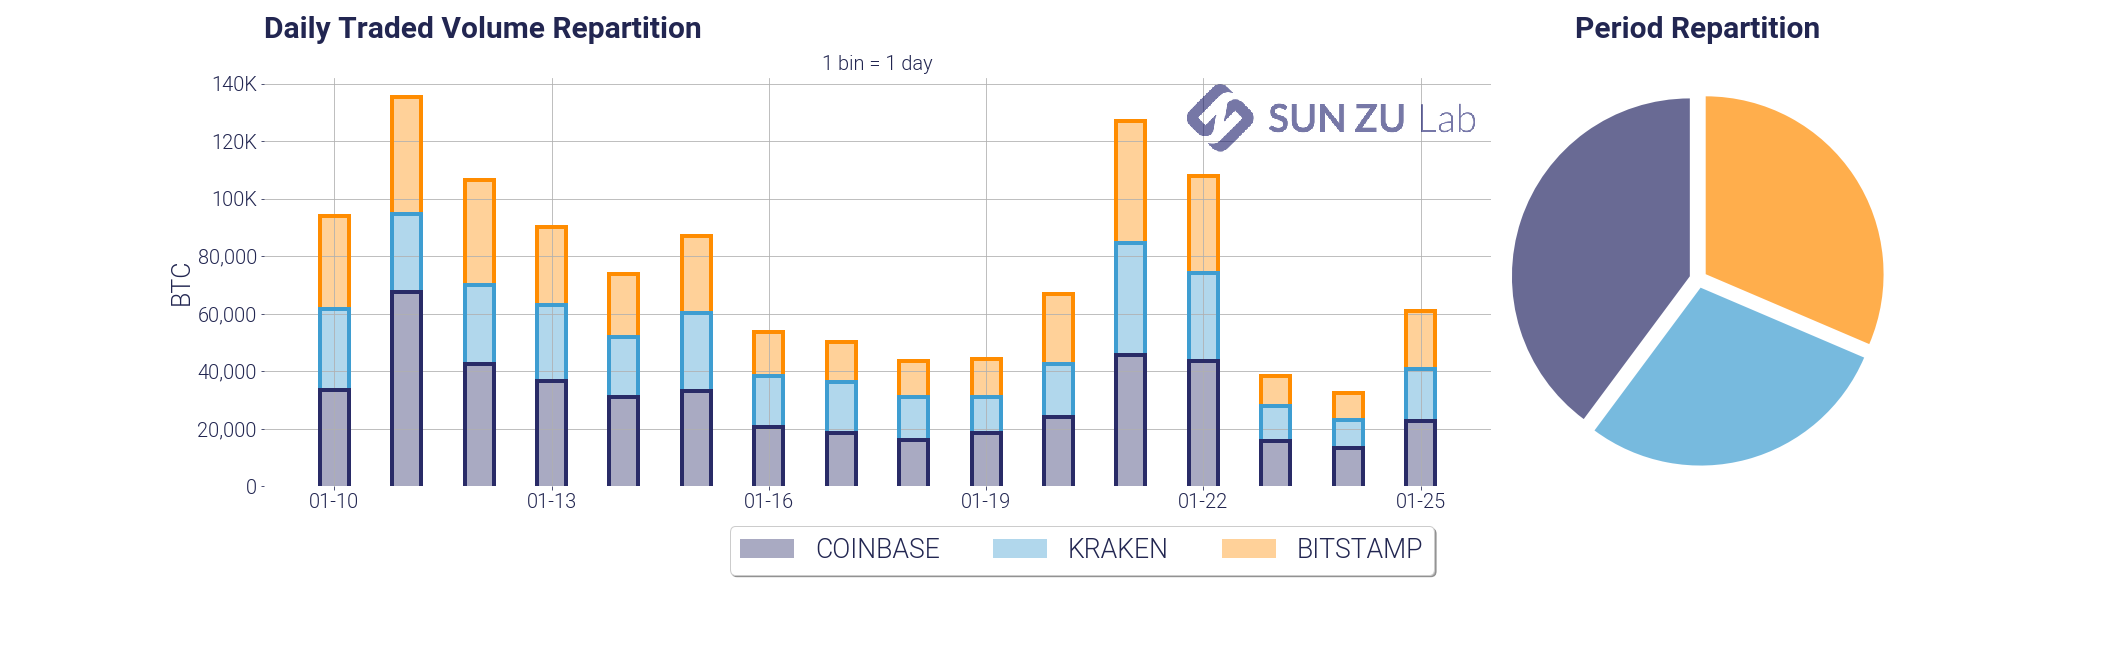
Those two charts are fairly standard representations of volumes. We present both views to determine whether there are intraday patterns that have developed over the observed window. In particular, we could expect higher volumes when Asian and/or US markets open. Quite naturally we need to address also the question of the relative partition between exchanges:
- daily and intraday annualized volatility:
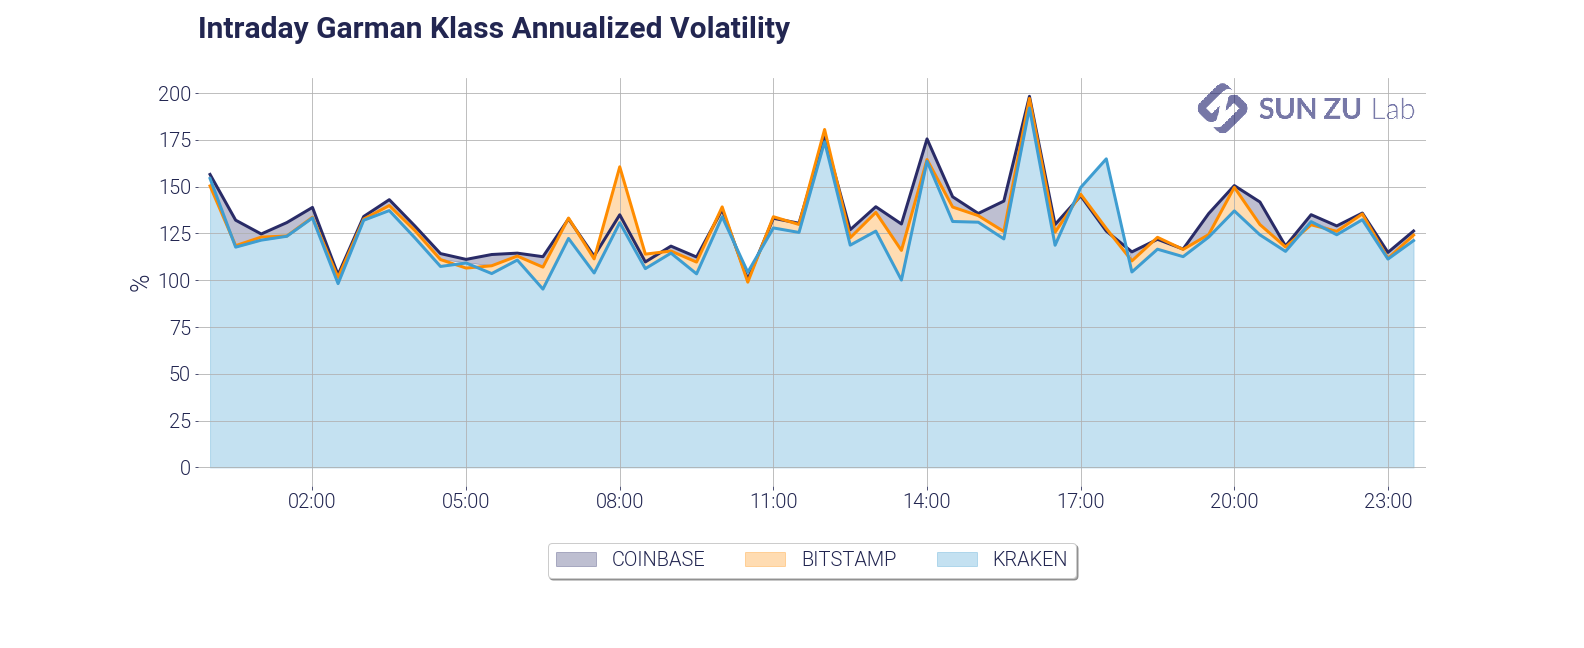
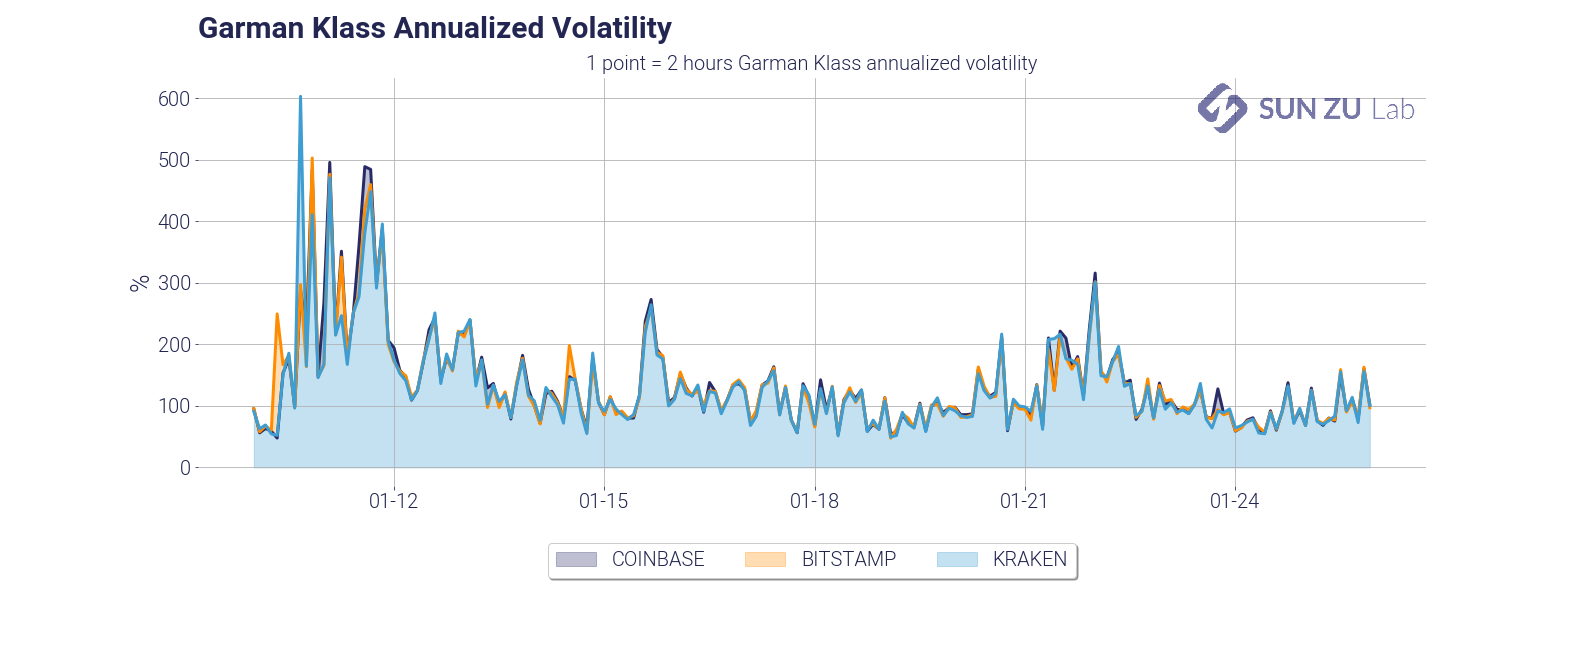
Similarly to volumes, we plot both the intraday and daily volatility to monitor whether intraday patterns developed. Despite the fact that the charts are very similar on distinct venues, we decided to keep them all, to make anomalies between markets stand out, should some come up.
- mean and median trade size (daily and intraday):
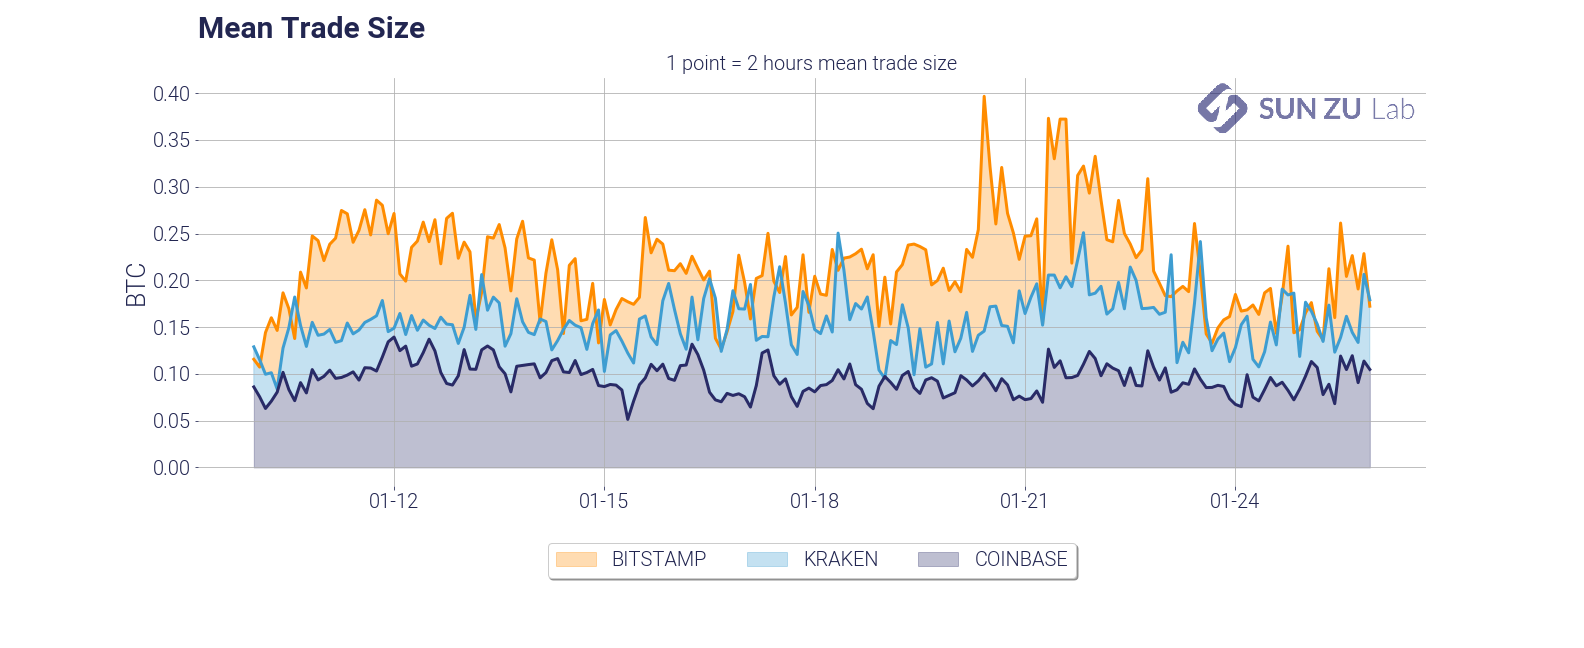
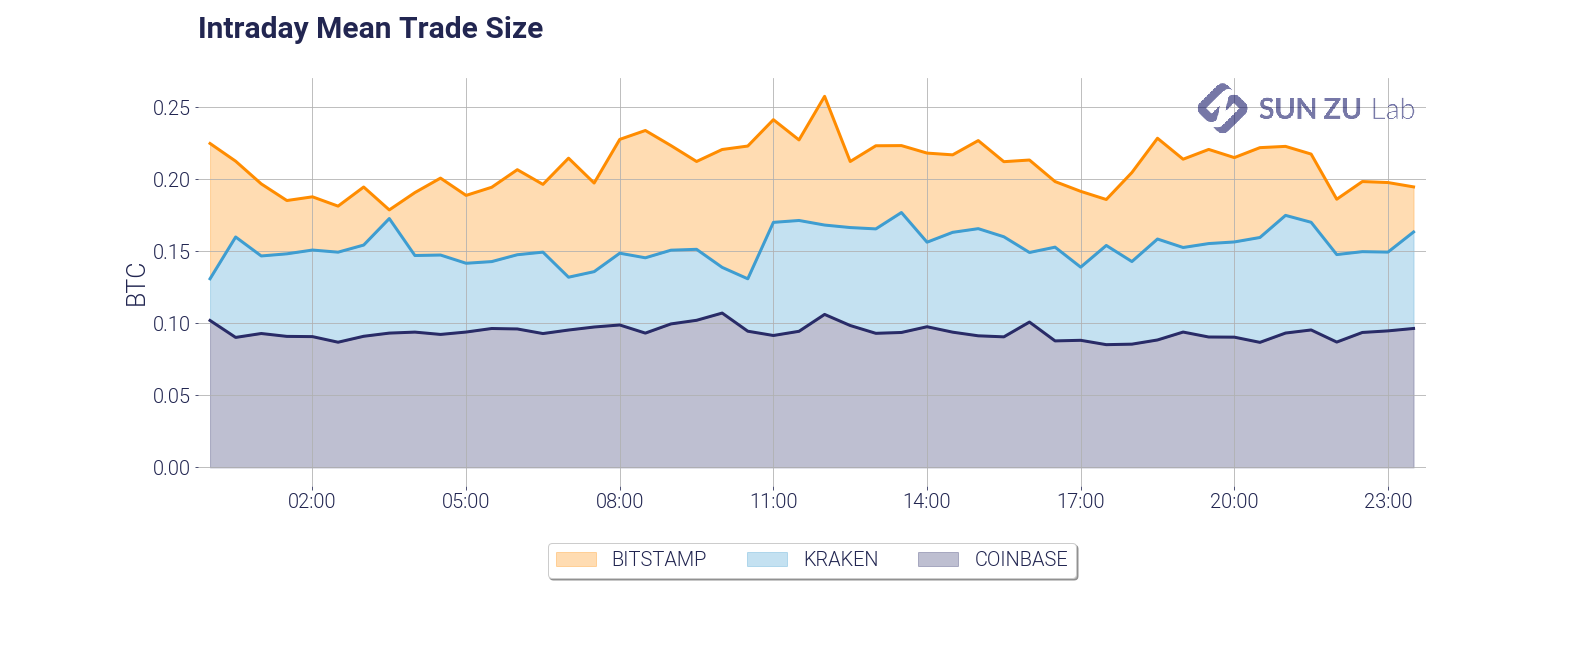
The average trade size is a very important feature of liquidity dynamics. It is dependant on a number of factors, such as the type of investors (retail, institutional), the pricing structure of the exchange (fixed vs. variable fees, caps on per-order fees), time of day, etc. We found in our research that infrequent large trades tend to alter the readability of the average, therefore we decided to include the median as well:
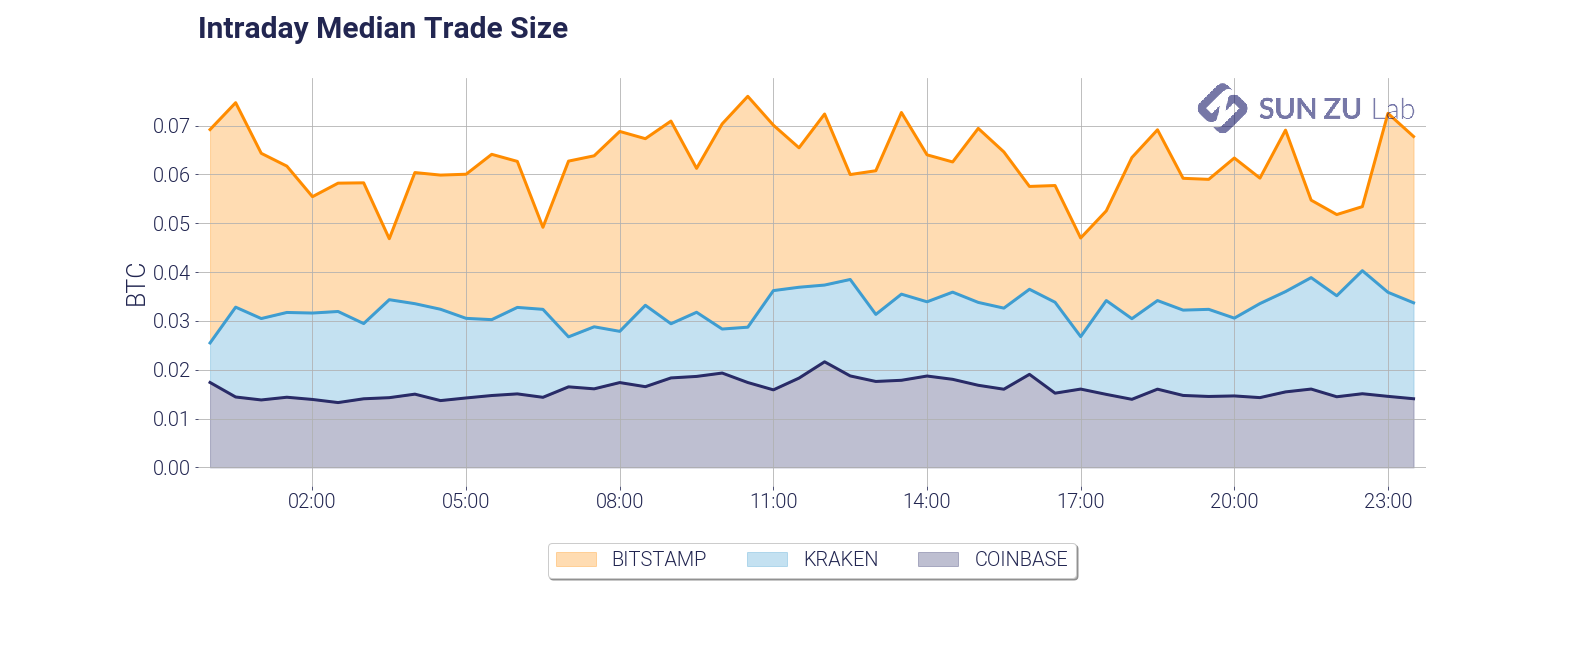

Believe it or not, we think there are many more questions that we should be asking. For example: how does trade size vary with volatility? with the bid-ask spread? We will absolutely incorporate the relevant metrics to answer those questions in due course.
- daily $10M and intraday $100K participation:
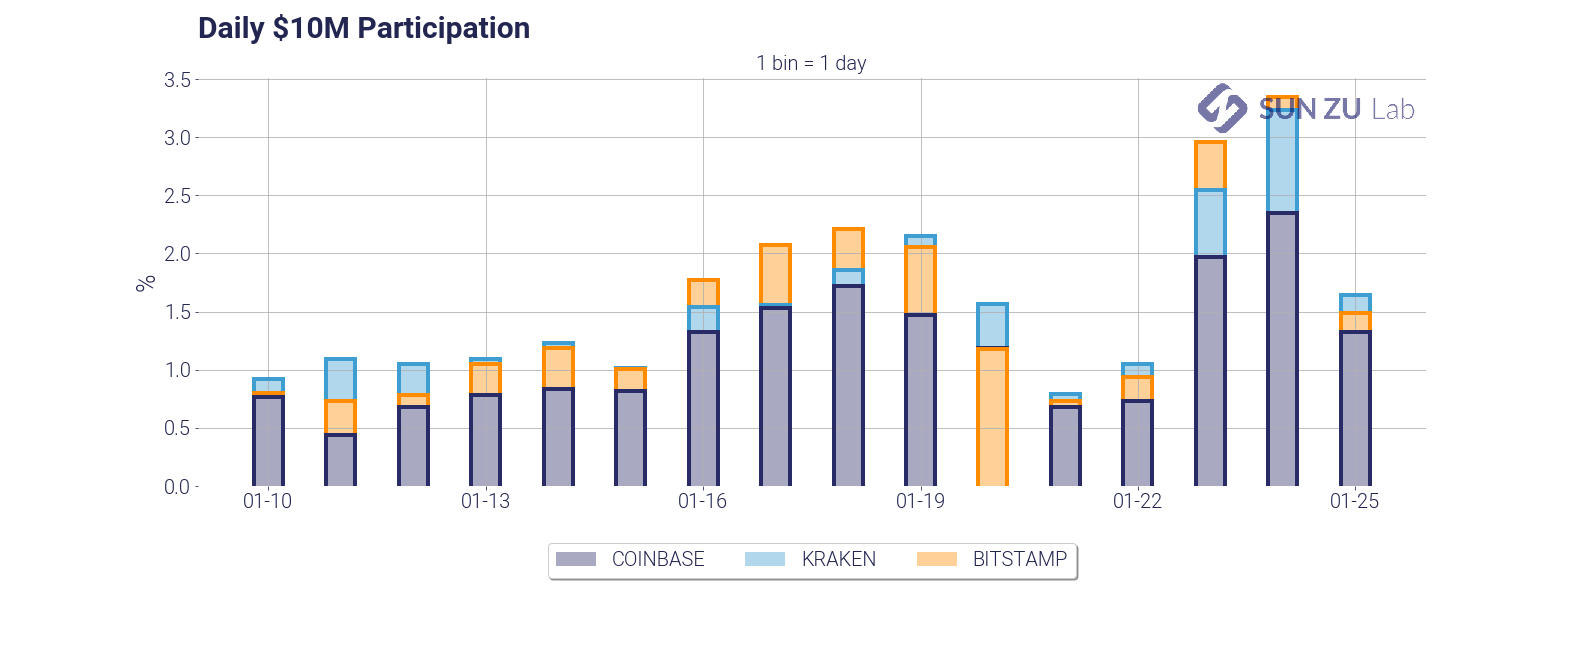
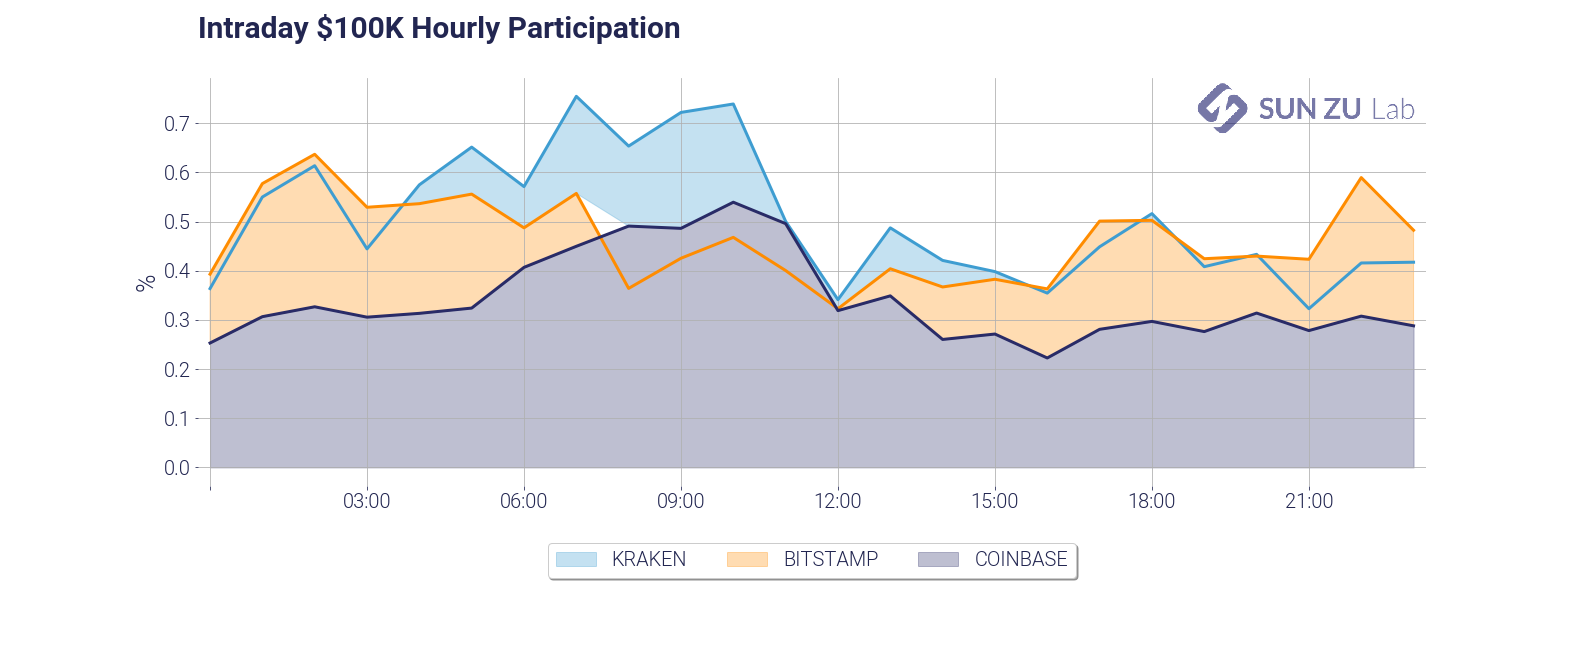
Those two charts give two measures of market participation. First, we answer the question: how much volume does it take on a given day to fill a $10M order? As you can see it takes anywhere from 1% to 3% of the daily volume, on each exchange taken independently. Practitioners in traditional markets advise their clients to never cross the 15%~20% threshold. In the case of BTC on those three exchanges, roughly 10 investors with a significant order would be enough to “drain” available liquidity. The second chart is an examination of the same question, with a shorter time frame (1 hour), and a smaller size ($100K). Markets seem to be amply capable of absorbing repeated $100K orders.
- intraday market impact of a $100K order:
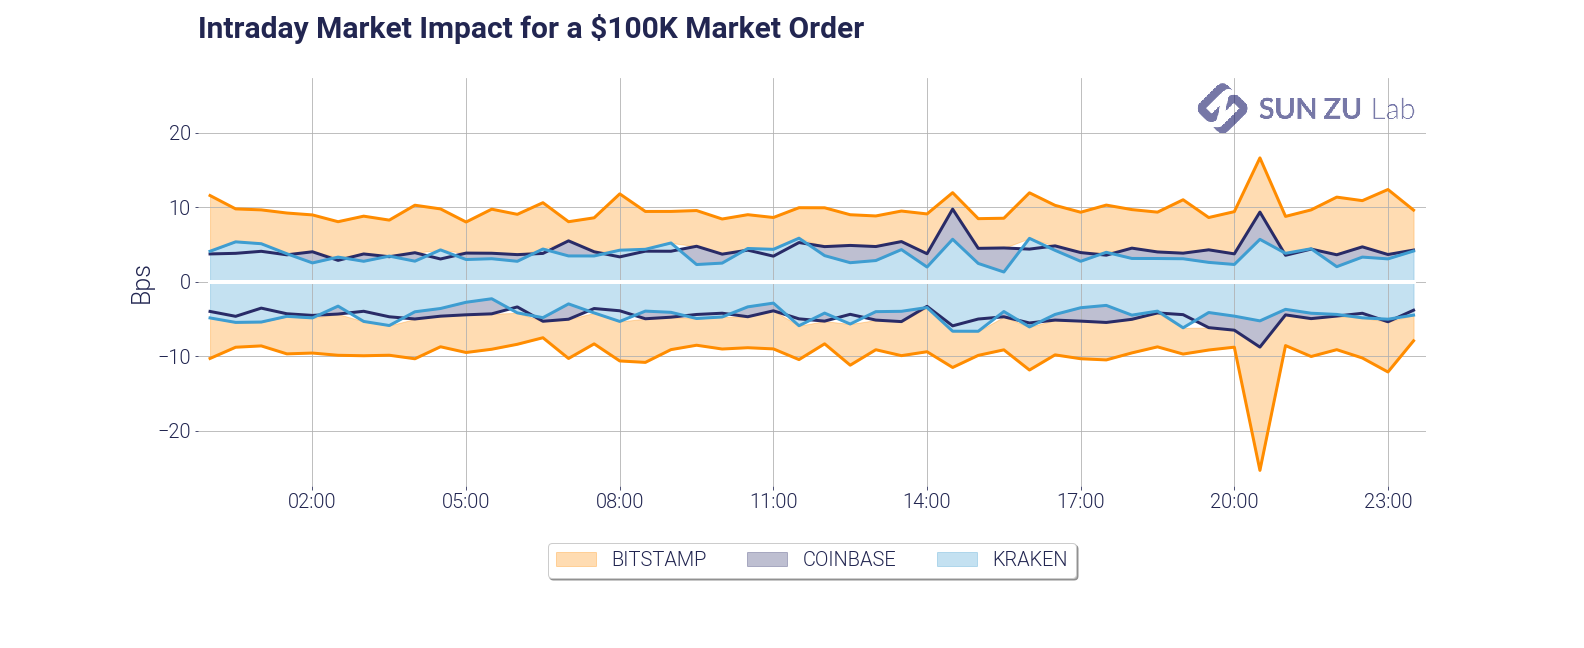
This chart is a slightly different take on market impact. It answers a different question: how much adverse price movement would a $100K market order create? This gives a measure of market depth, which as you can see is fairly stable in time but quite different across venues.
- intraday ratio between traded and available volume:
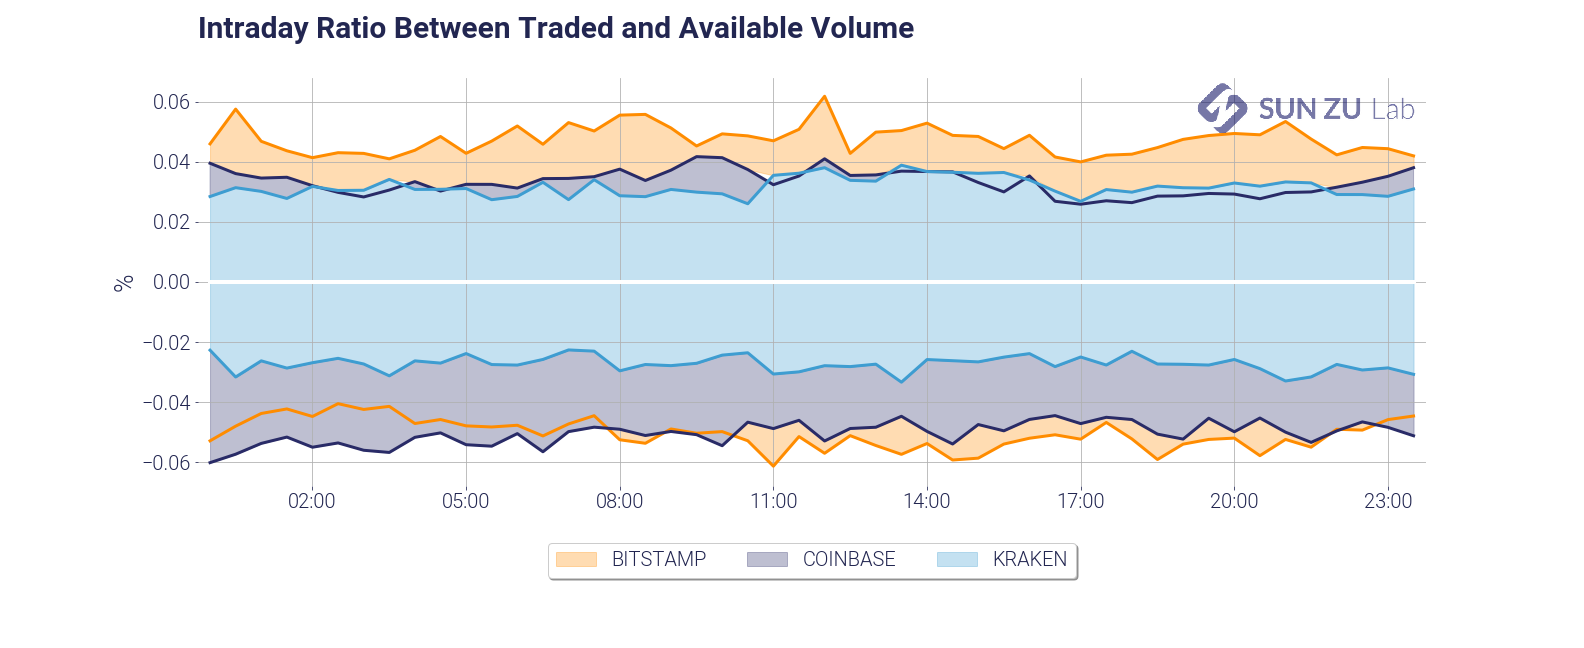
By definition, each trade “consumes” part of the visible liquidity. What ratio of the liquidity available is consumed, and how fast is it replenished? The chart gives an answer intraday. As can be seen, there seems to be a somewhat constant rate of consumption and replenishment, something which is somewhat surprising. Again, we will absolutely look at this in deeper detail in due course.
- volume at best limits (daily):
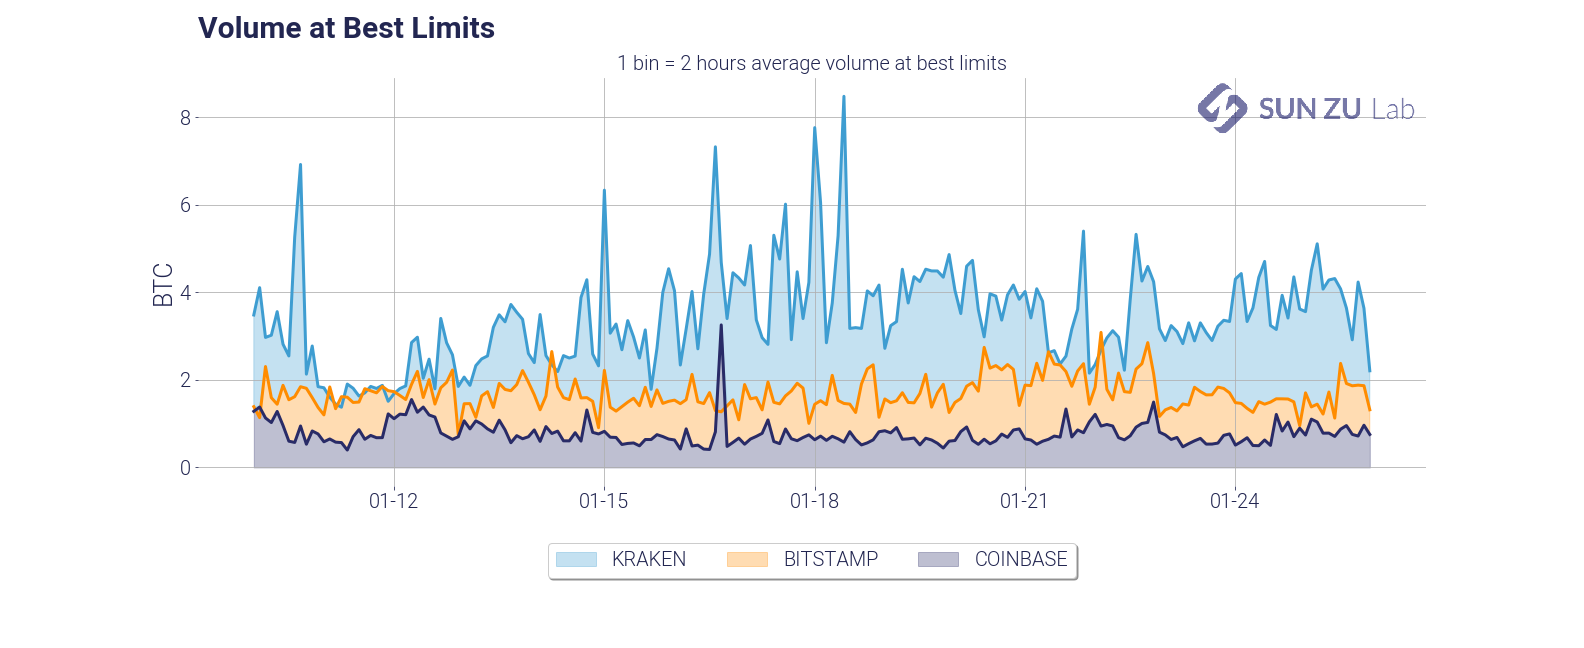
This chart presents a view of the total size available at best limits, in each of the individual order books. It is useful to monitor absolute levels of “aggressiveness” from market participants, and patterns in the overall migration, if any, from one venue to the next.
- intraday mean price difference and mean time between subsequent transactions:
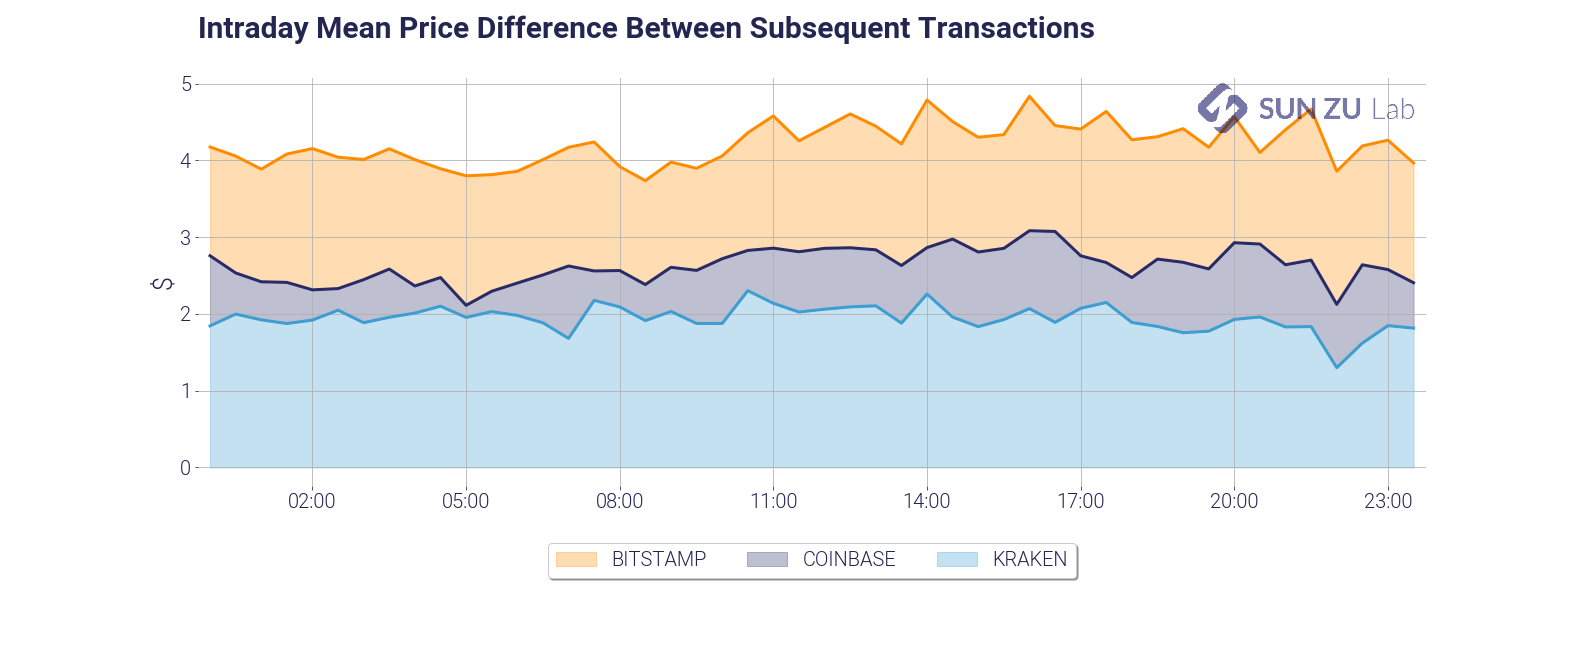
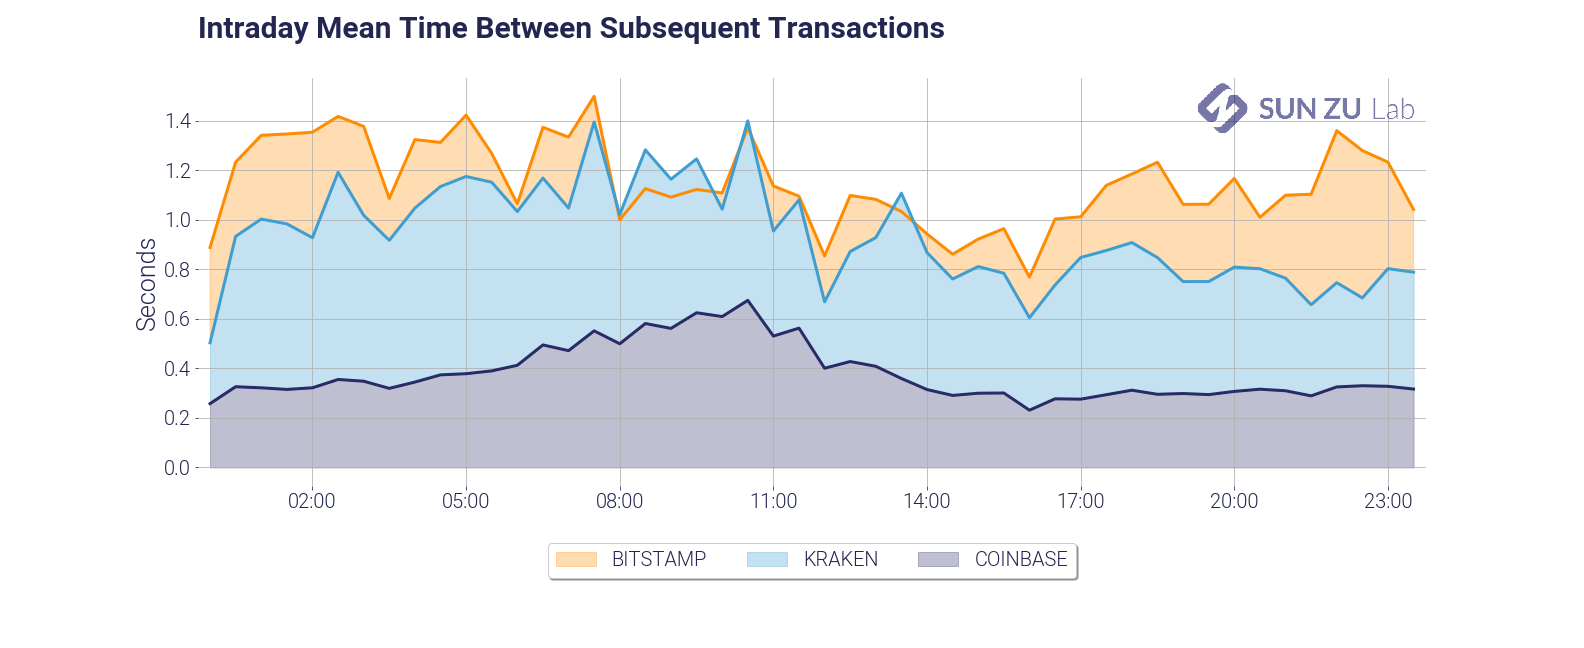
Those two charts present an introduction to order book velocity. Each venue has its core client base, and those may have very different trading habits. Those habits are also constrained by venue-specific factors such as commissions, API throughput, matching engine performance, etc. Investors may gain valuable insights by qualifying each venue’s reactiveness and specific velocity.
- limit order book distribution at +/- 100 bps and +/- 400 bps from mid-price:
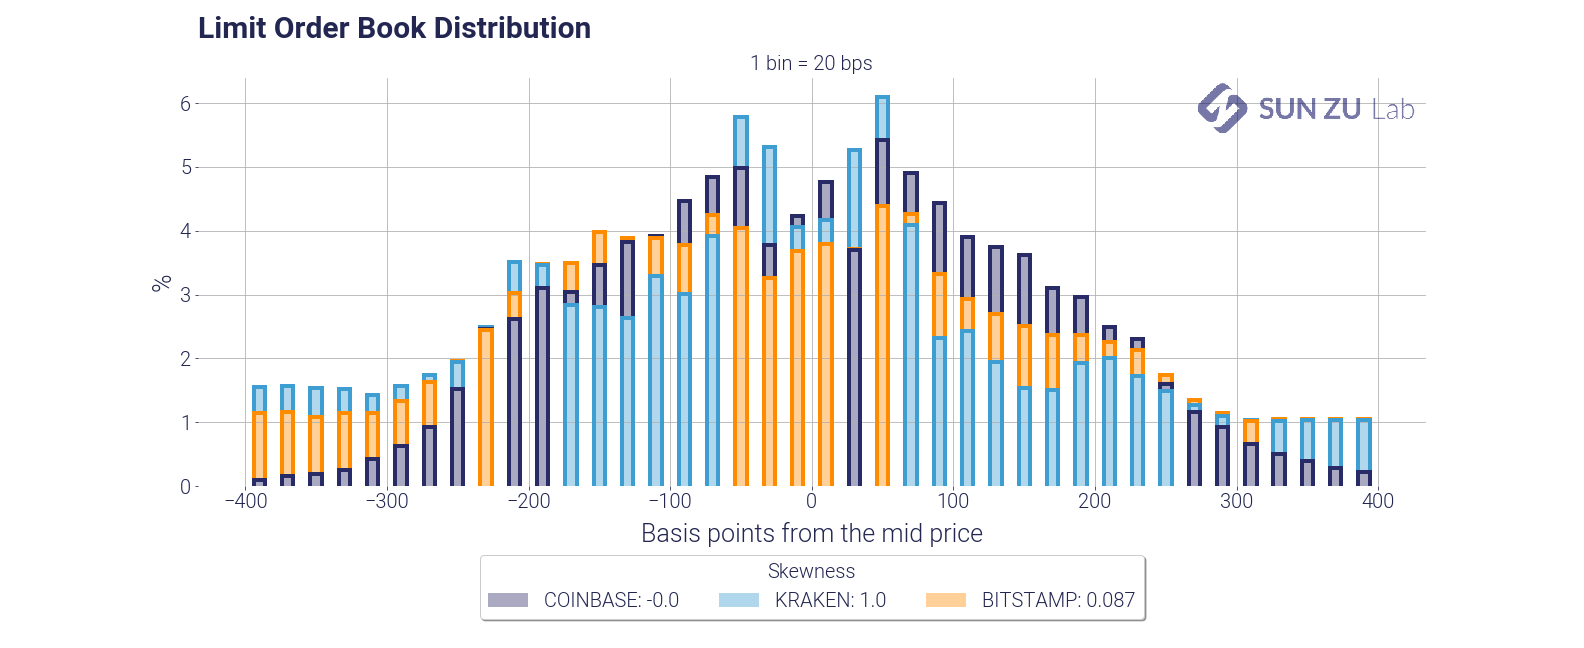
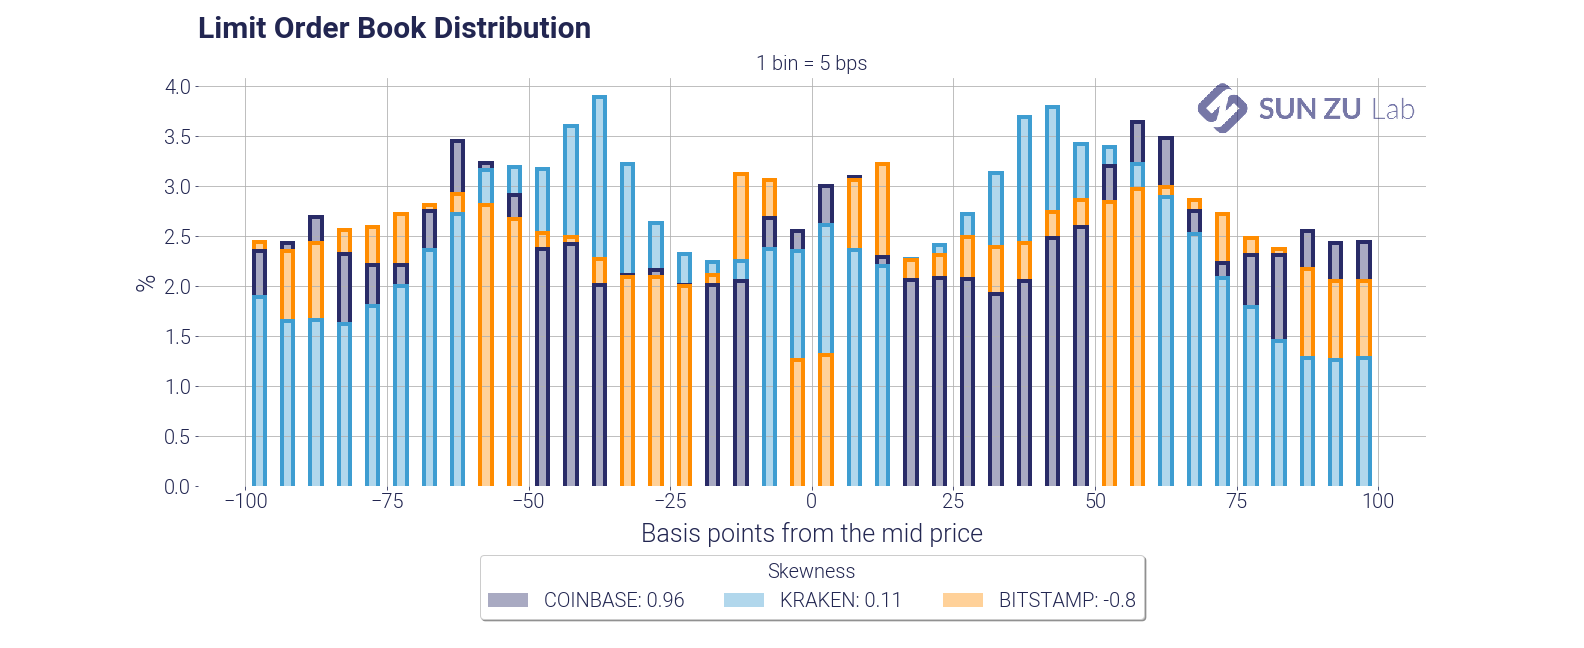
Those charts present the distribution of each order book around mid-price, for a depth of 100 bps and 400 bps. There is a wealth of information to be extracted from those distributions. Here are two examples.
First, they indicate how participants think about risk beyond the first limits: are they placing a lot of orders away from mid? if so, are those significant compared to the best limits?
Second, how does each venue compare? Am I more likely to find liquidity at 50 bps from mid on Coinbase or Kraken? What about 100 bps?
Market makers, speculators, institutional investors have very different trading strategies. Market makers may be interested in price discrepancies, which would lead them to participate symmetrically from mid-price. Institutions may be more buyers or sellers at different times. In each case, they would presumably occupy one side more than the other. Although the averaging in the above charts provides a lot in readability, it is also the source of much “compression”. We have a lot more to say on order book dynamics, and in fact, it will be the subject of an entirely new report soon!
- limit order book imbalance:
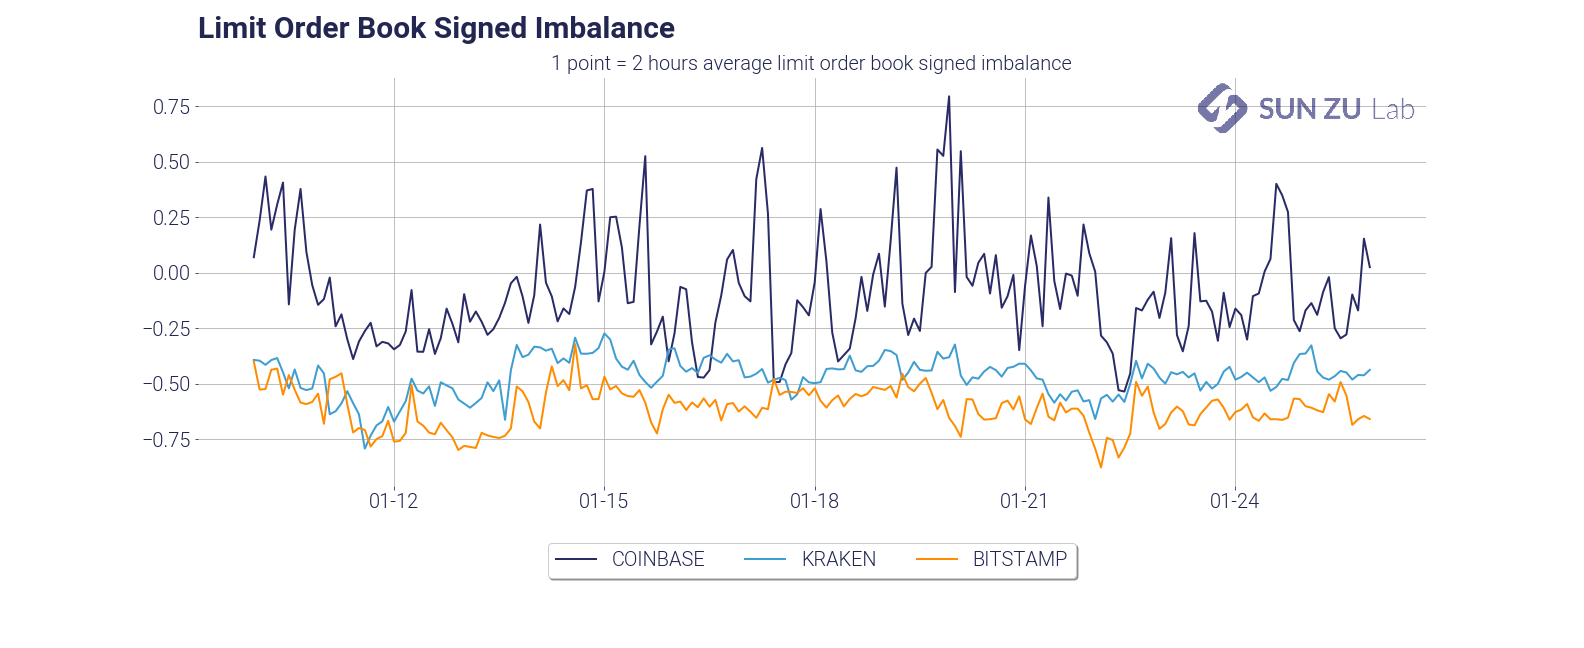
Popular wisdom would have that a trending market shows asymmetry in liquidity. Well, unfortunately, this is not quite as simple as that. The graph above represents the order book imbalance by trading venue. Order book imbalance is defined as (Qa — Qb)/(Qa + Qb), where Qa is the total quantity, available at 100 bps from mid on the offer, and Qb is the total quantity available at 100 bps from mid on the bid.
Imbalance oscillates between -1 and +1: a market with no bid (Qb = 0) has an imbalance of +1, and -1 for a market with no offer (Qa = 0). An imbalance close to 1 means the order book is dominated by offers and vice-versa.
It is very apparent that the three exchanges have very different imbalances. At 100 bps market depth, Coinbase is mostly an “offer” market (with variability), whereas Kraken and Bitstamp are mostly “bid”.
- average market depth:


Total visible liquidity is a very natural question: how many bitcoins are available in each order book? Those two charts present two different answers to that question. On the left, absolute size at 100 bps, on the right intraday depth at 10bps. Those can help provide first-order estimates of impact: 100 BTC can be executed with a max impact of 50 bps; at any time, an order of 10 BTC should not be filled more than 10~15 bps from mid.
- spread and weighted spread distribution:
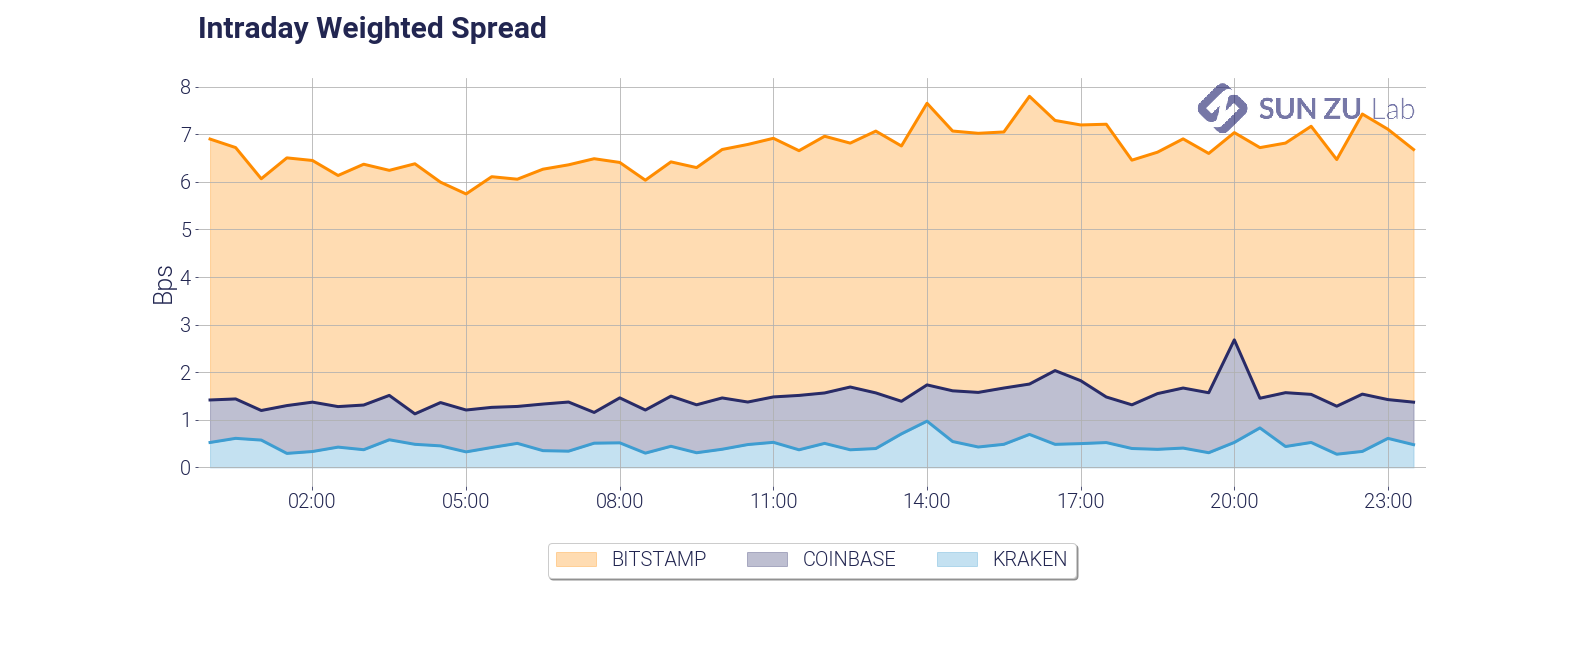
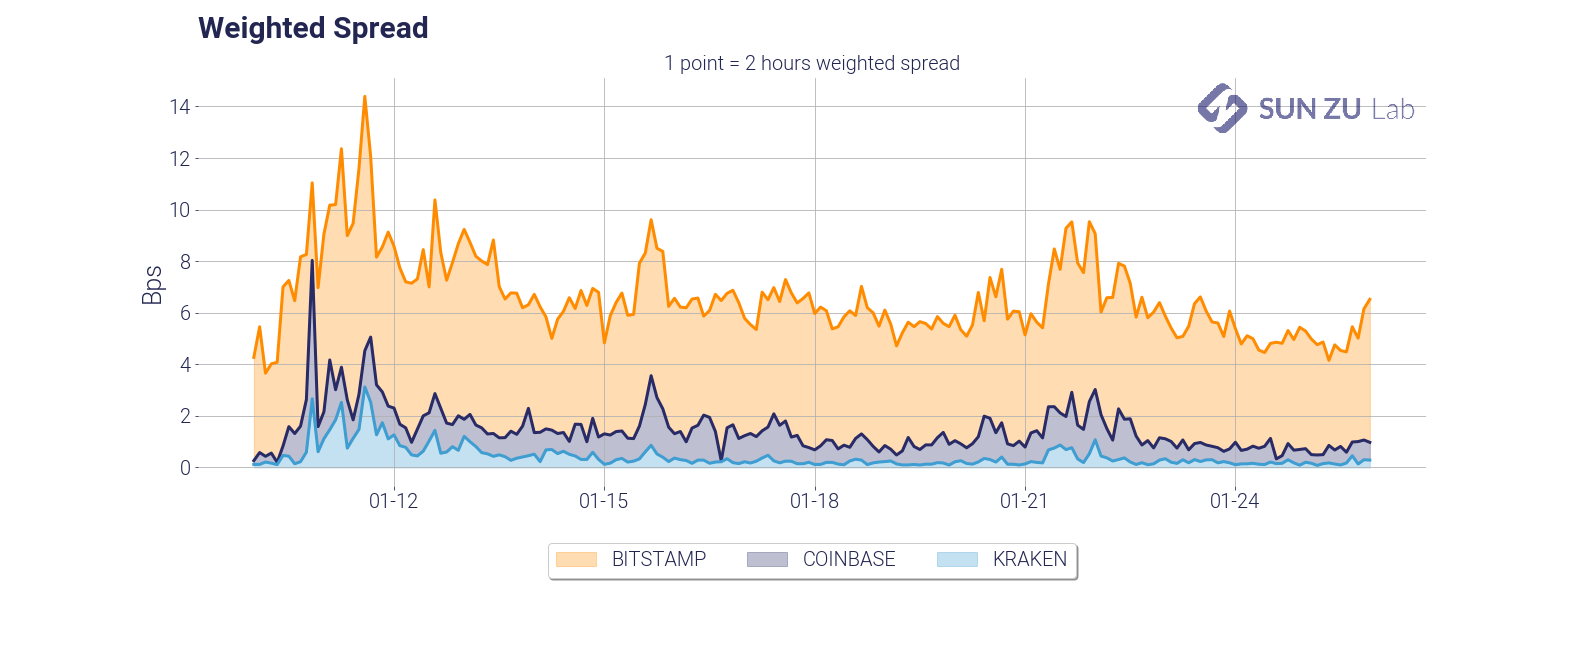
Of course, no study of liquidity would be complete without spread analysis. Above are time series of the weighted spread, showing intraday and daily dynamics. Unsurprisingly the weighted spread deteriorates quickly with volatility (early days in the chart). The charts below enable comparison between a simple spread and a measure weighted by the total quantity on best limits (bid + offer):
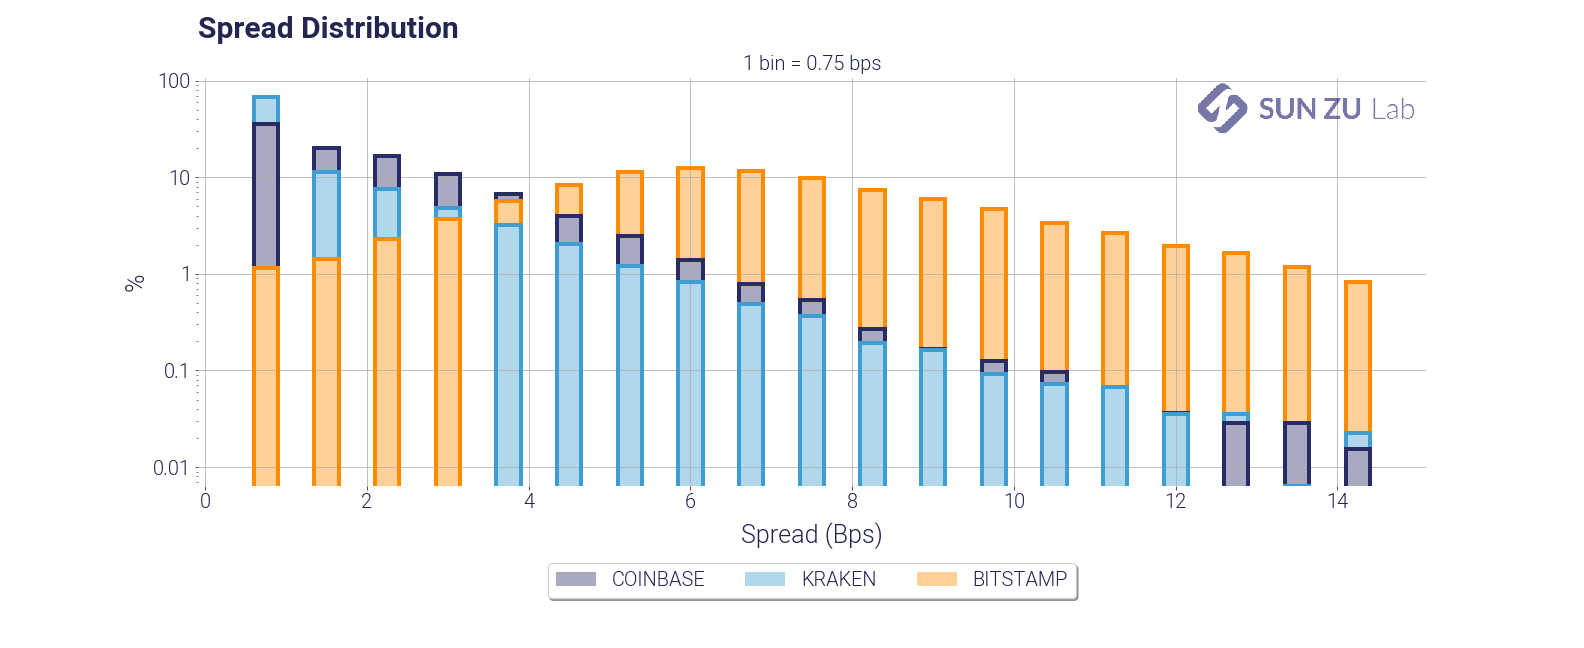
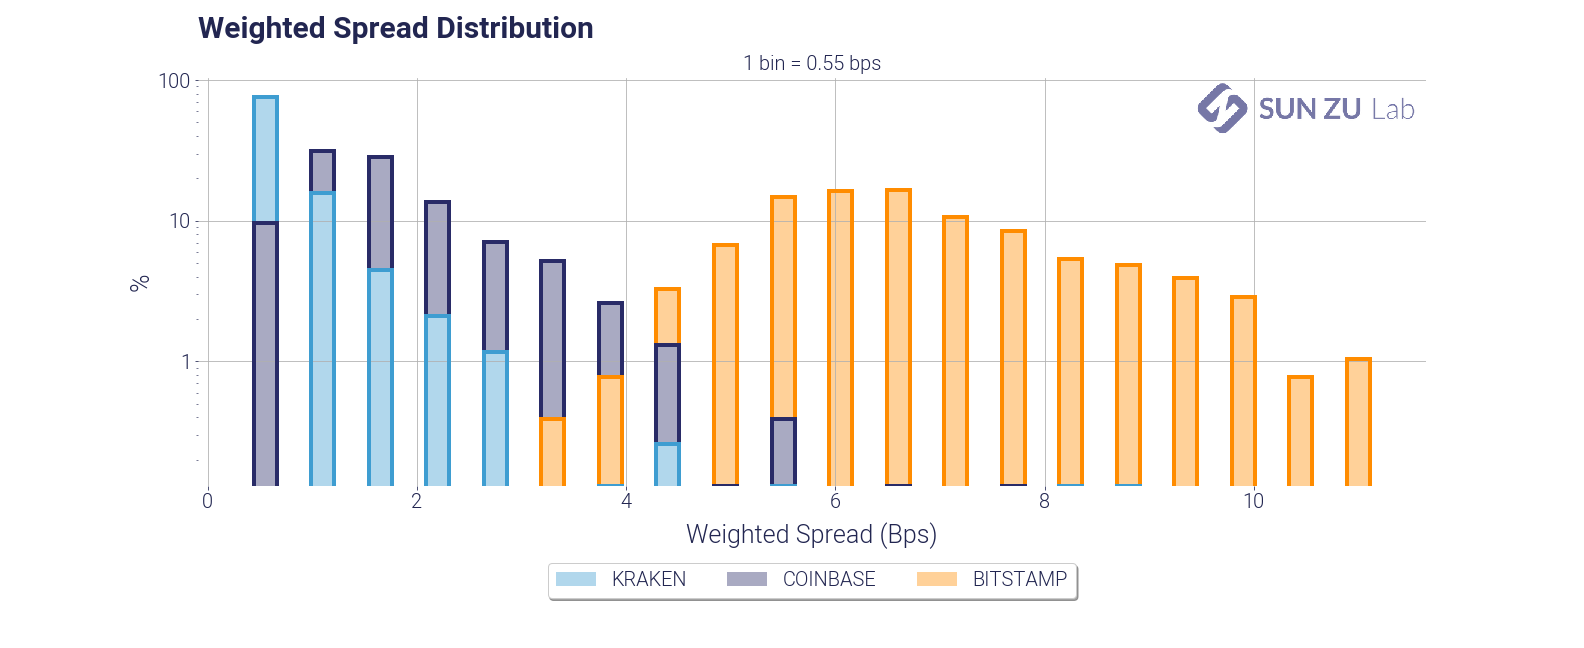
It can be seen quite easily that exchanges have very different order books.
Now this is a long list of charts and tables. You may get a sense that a lot of it is repetitive. We would argue that it is not, quite the contrary. As was said earlier liquidity is an elusive parameter, and in the world of digital assets it is bound to evolve very quickly. Monitoring and understanding it appears to us an important prerequisite for traders already active in the space, or even for “crypto curious” i.e. investors or institutions interested in the subject but not yet in a position to transact.