
What a strange market!
We at SUN ZU Lab are striving to gain a deep understanding of how the markets for digital assets function, to help our clients achieve their investment strategy through better execution. Based on our long (very long!) experience of traditional markets, we have started looking closely at liquidity and arbitrage. The interested reader will find a sample of our efforts here.
We subsequently turned our attention to the basic behavior of trading venues, trying to understand if there was something special there compared to what we knew of traditional well-established exchanges. Thus we started looking at small-scale data to try and detect unusual patterns. Because we aimed at being as systematic and unbiased as possible, we devised automated filters to isolate those events.
The result is our latest weekly “market anomalies” report, which presents events selected because of a sharp price movement or heavy volume. For each of those events, we look at price discrepancies and/or volume patterns. Well, the results are quite surprising, here are three examples abstracted from our report dated March 26th for bitcoin.
Price anomaly #1: -1.53% on 3/21/21 between 09:43 and 09:44 UTC
By looking at the most significant price movements over a 1-minute interval we can detect periods where markets are moving “fast”, and those moments are very good candidates to detect unusual price or volume patterns.
As an illustration, below is the 1-minute charts of BTC prices and volumes on 5 venues, between 9:43 and 9:44 on 3/21:


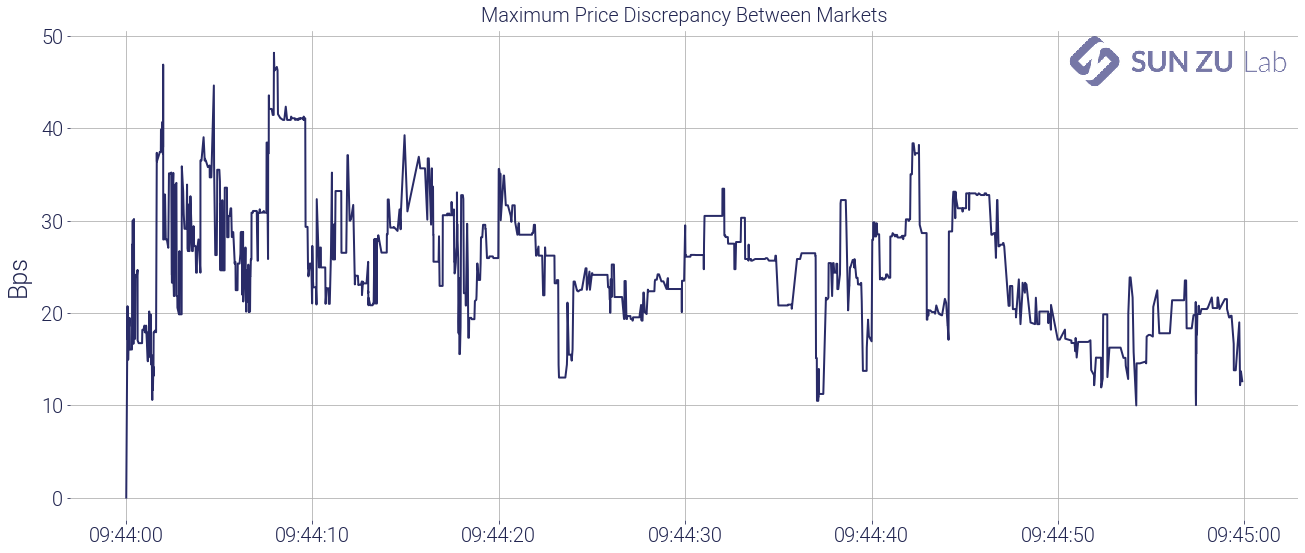
To get a better sense of price discrepancies, we chart the maximum price difference in the interval between the lower and higher price:
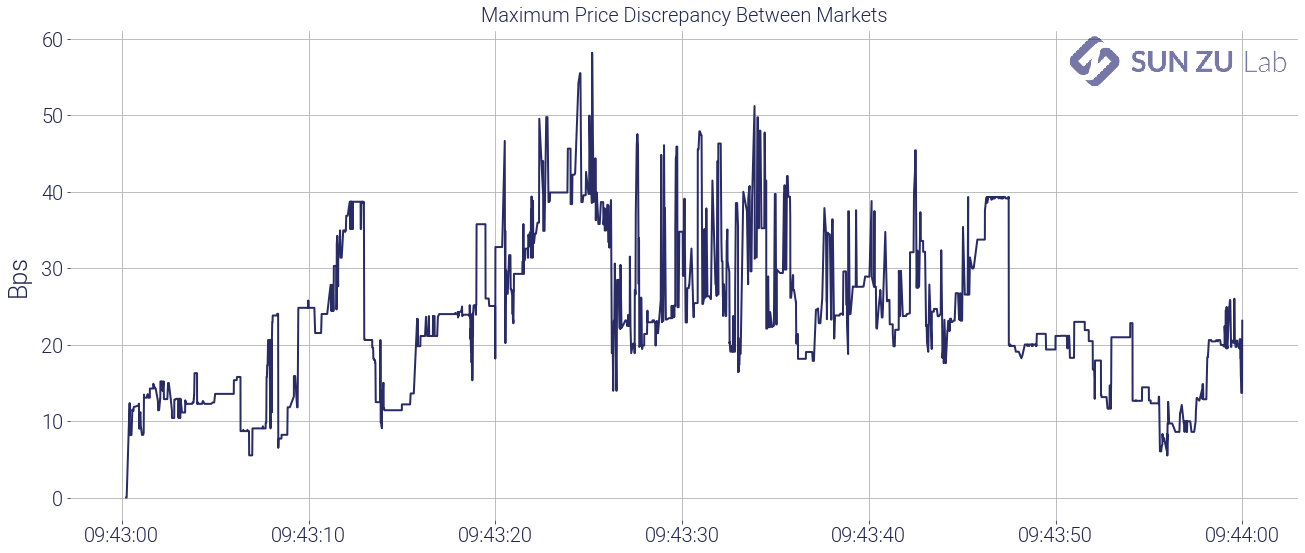
It is fairly clear that during this period, prices on the different venues were far from being “aligned”. In another of our reports, we look at price discrepancies and arbitrage opportunities at a macro scale, but here at the tick level, we suspect there are opportunities to be grabbed.
Or are there? Let’s have a closer look at the strangeness of this picture:
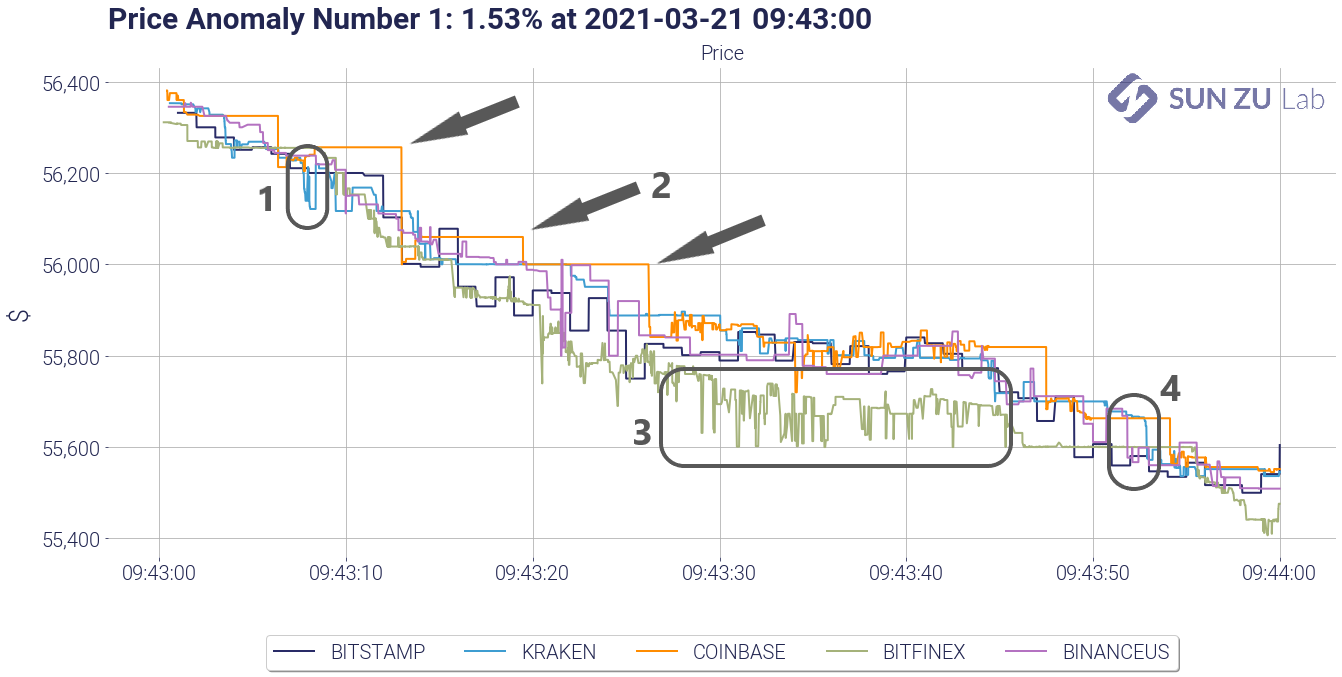
I have numbered 4 surprising patterns:
- a small blip of Kraken vs. other exchanges: what is happening on Kraken at that precise time? BTC is trading there several times $100 below other markets. What is unexpected is not the fact that one venue experiences sharp movements independently from the others. The surprising part is that none of the other venues moves in sync. We strongly suspect that there are many arbitragers out there sharpening their trading algorithms to specifically identify and exploit those situations. Why was there no change anywhere but on Kraken? One possible explanation is that there was not enough time to capture that opportunity. Well, this is unlikely because as it happens all venues traded repeatedly during a window that lasted several seconds. Another explanation is that bid/ask spreads were very wide and trades occurring on one side of the spread appeared to be out of sync. Investigating that idea requires tick-by-tick order book data, and a little bit of work (but do not worry we are on it). Another explanation could be that some of the trades on Kraken were fake trades, or that they happened outside the regular bid/ask spread if they were “pre-negotiated” (a particular status that indicates a block trade on traditional exchanges). In any case, we would need a little bit more information from the exchange to be able to conclude.
- Coinbase price seems to be lagging: as surprising as it looks, this type of pattern is quite straightforward to explain. It results from the lag in order book positioning on Coinbase. The bid/ask spreads on other exchanges adapts more rapidly, which means that prices tend to lag and adjust at the last moment (i.e. the next transaction) on Coinbase. Again confirming this initial intuition requires tick-by-tick order book data, but nothing worrying there.
- Bitfinex at $100 to $150 discount compared to other markets: well, that’s a big one. The discount on Bitfinex appears 20 seconds before but stays stubbornly high. It appears and doesn’t disappear for some time (see #2 anomaly below where it exists with the same magnitude). A discount like this would rarely appear on traditional markets (stocks, derivatives, bonds, etc) because market participants would arbitrage it away sooner rather than later. If it persists as it does here, it is not your typical liquidity discount. Indeed, it is associated with Bitfinex, other exchanges keep trading in sync (more or less). Therefore the underlying reason is to be found with the specifics of Bitfinex: are there trading constraints that would induce investors to severely discount BTC on that platform compared to another? Indeed our research confirms that this discount appears quite regularly, and never turns into a premium. Investors should therefore be mindful and investigate further the underlying reasons that could create a recurring anomaly like this (as will we!).
- $80 price difference between Kraken on one side and Bitstamp/Binance on the other: whereas Kraken was at the bottom before, it is now trading higher than the others. Coinbase is lagging, Bitfinex is still at a discount, but Bitstamp/Binance and Kraken repeatedly trade at a $100 difference for 6 to 7 seconds. Are those real arbitrage transactions or “visual effects” due to lagging or fake transactions? As before we need tick-by-tick order books to conclude, and possible further information from the exchanges if everything else proves insufficient.
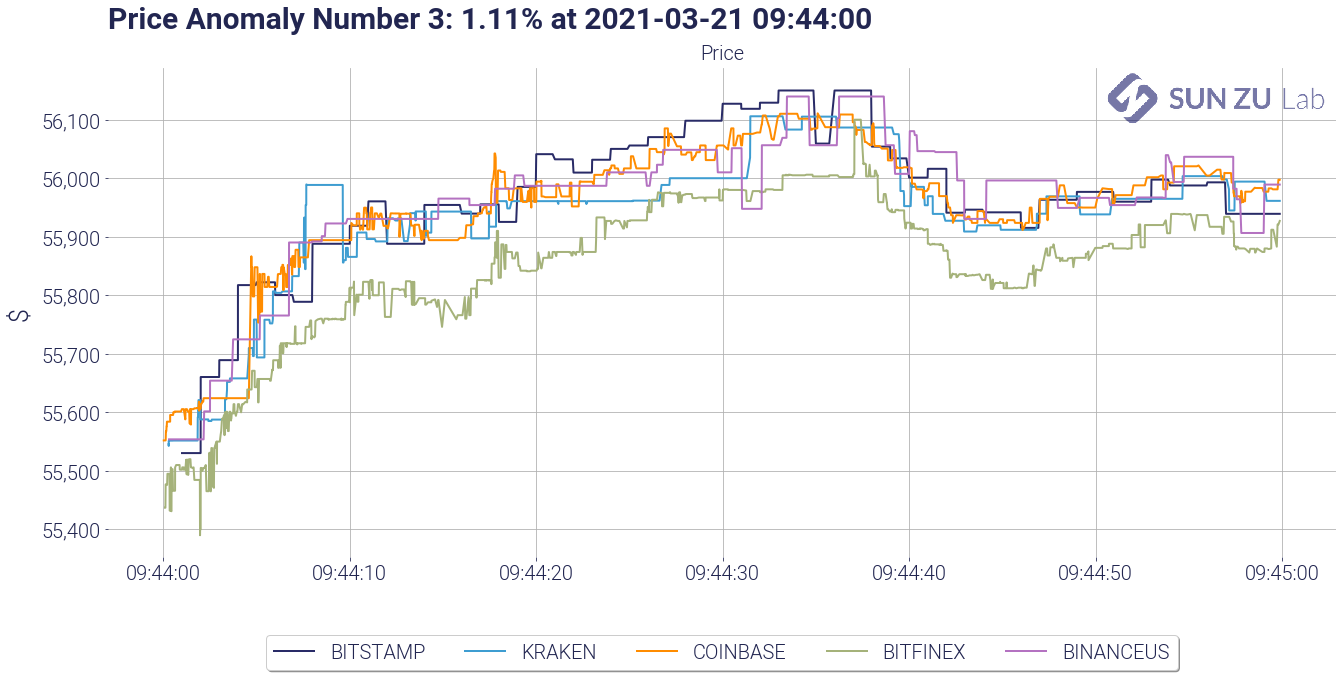
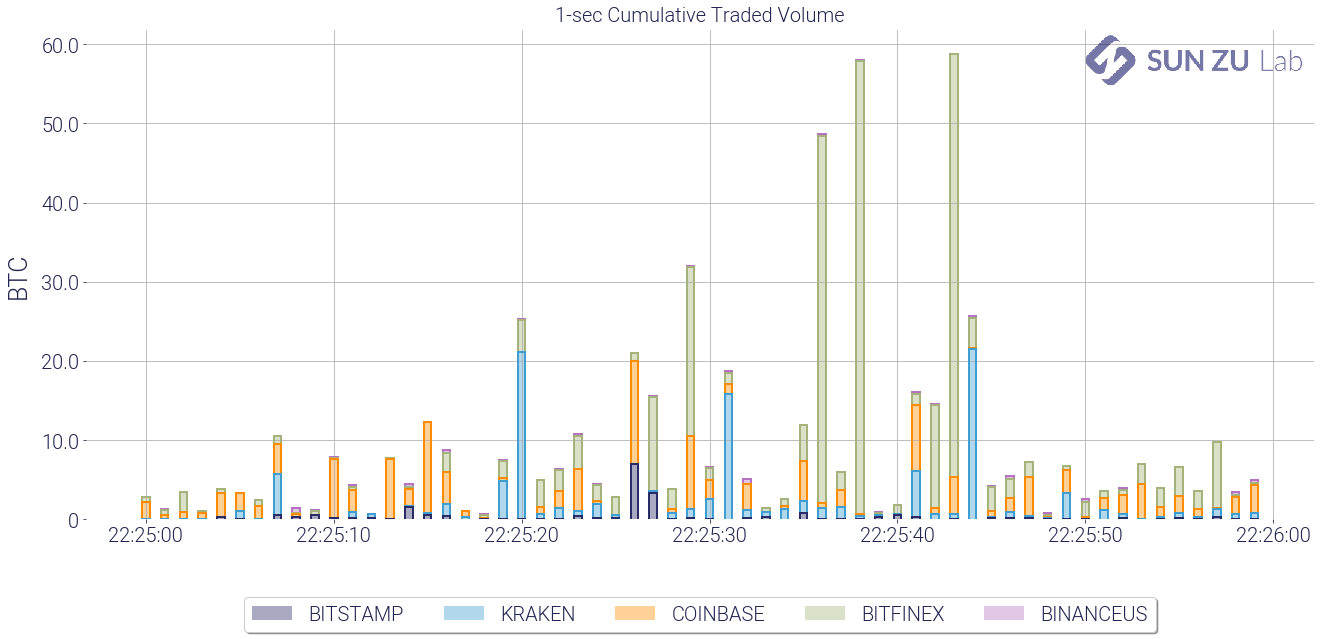
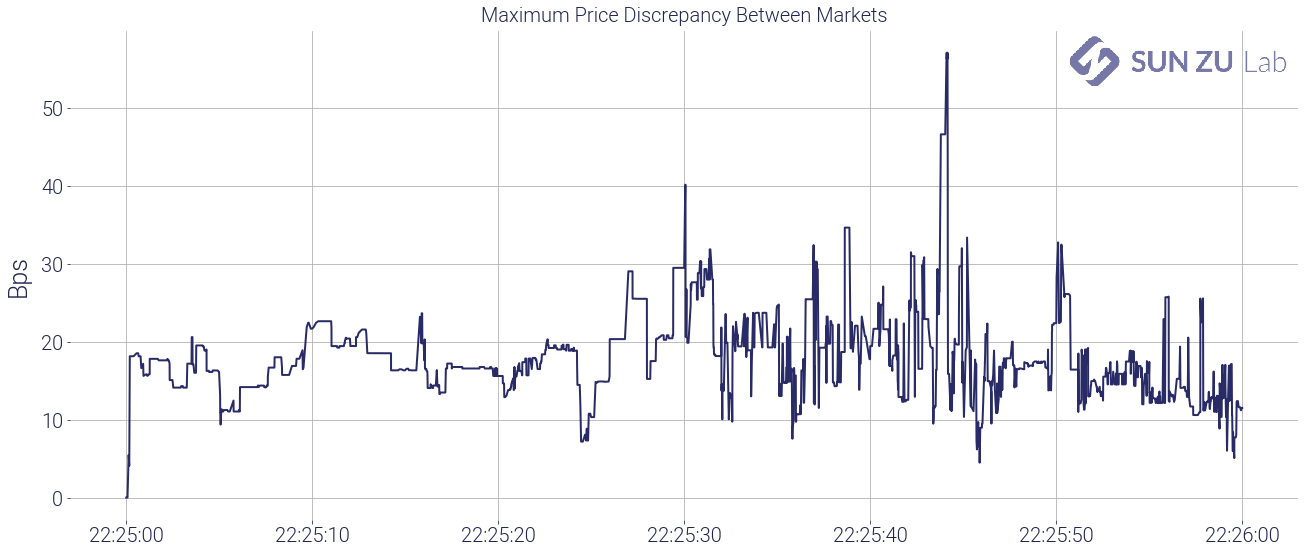
For the sake of curiosity, below are two more anomalies abstracted from our report. The reader will find the Bitfinex discount again, and long, recurring inter-venue price discrepancies. NB: the last anomaly is one detected through our volume filters, hence labeled “volume anomaly”. Volumes on Bitfinex appear as extreme outliers, accompanied by price dips that have a very small impact on other venues.
Price anomaly #2: +1.11% on 3/21/21 between 09:44 and 09:45 UTC
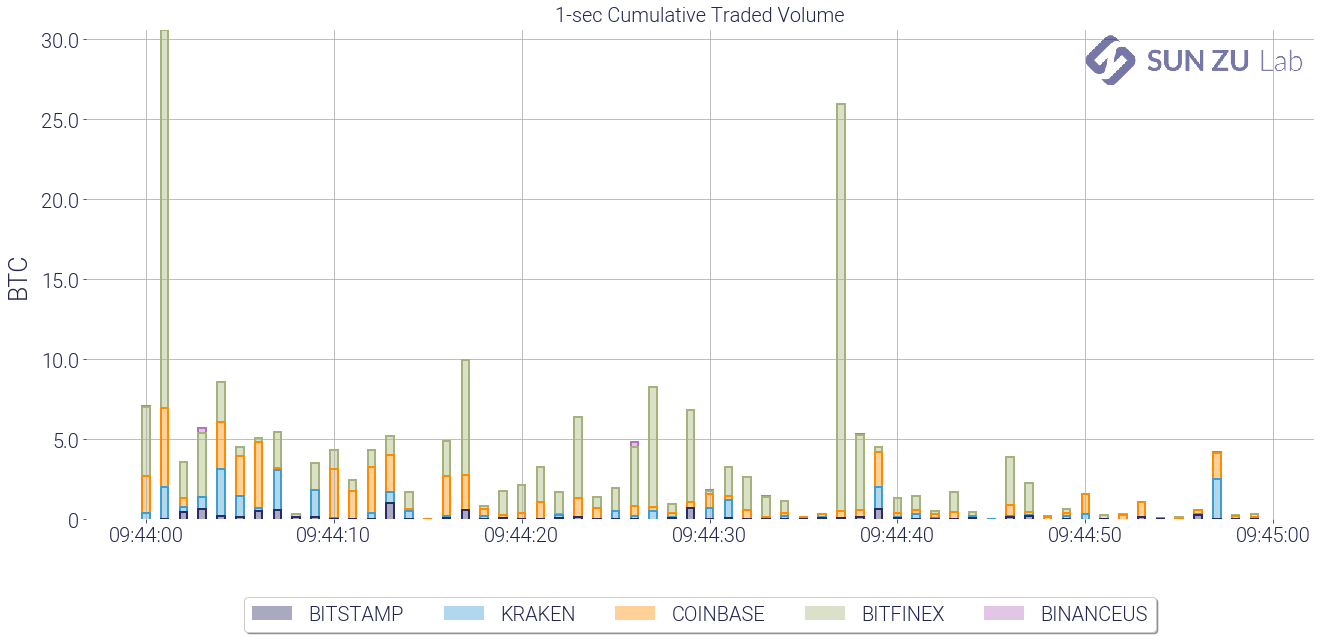
Volume anomaly #1: 706 BTC on 3/21/24 between 22:15 and 22:16

Well, we knew digital asset venues were not so closely integrated, but here we have a very detailed view of anomalies that are curious and result in significant price discrepancies. To track some of those anomalies regularly, we will produce a weekly report incorporating the above results (and more!) for BTC as well as other digital assets. Investors seriously curious about cryptocurrencies and digital assets may find in those a way to monitor market efficiency and as it evolves through time and across trading venues.
If you want to follow our research and efforts to shed light on all things related to the liquidity of digital assets, register for a 30-day free trial on our research, consult our website, or contact us. Feedback and comments are always welcome!