By Chadi El Adnani, Crypto Research Analyst @SUN ZU Lab
The “odd-eighth quotes” phenomenon
To introduce this article about Transaction Cost Analysis, we first revisit a very famous historical case. Before decimalization, the US stock market tick size used to vary by increments of 12.5 cents. This means that all prices were quoted in eighths of a dollar (ex. $12 or $12 1/8). However, on May 26 and 27, 1994, several US national newspapers reported an article that first appeared in the Journal of Finance (“Why Do NASDAQ Market Makers Avoid Odd-Eighth Quotes?”, by Christie, Harris and Schultz) raising the question of the width of the range of prices quoted by NASDAQ market makers. The researchers had found that the prices quoted to investors were almost systematically 1/4 ($0.25) apart, thus avoiding the minimum allowable 1/8 spread ($0.125)
To get a first grasp of the implications of this situation, we need to highlight that the range quoted by market makers is a good indication of the maximal margin they intend to capture. So by quoting a stock at $12 – $12 1/4 (i.e. they are willing to buy at $12 and sell at $12.25), instead of the allowed $12 1/8 – $12 1/4 range, market makers are refusing to decrease their margin bellow $0.25. So what would prevent market makers from avoiding odd-eighth quotes on 70 out of 100 actively traded NASDAQ securities, including Apple Computer and Lotus Development? The authors found no explanation and concluded that the situation was probably the result of implicit collusion among the participants to maintain wide spreads.
Surprisingly, On May 27, dealers in Amgen, Cisco Systems, and Microsoft sharply increased their use of odd-eighth quotes leading effective spreads to fall “magically” by nearly 50%, this pattern was repeated for Apple Computer the following trading day. Noticing these weird trends, the same authors published a new article a few months later to reconduct their investigation (“Why did NASDAQ Market Makers Stop Avoiding Odd-Eighth Quote?”). Using individual dealer quotes for Apple and Microsoft, the authors found that virtually all dealers moved in unison to adopt odd-eighth quotes.
These strange findings led thousands of individual investors to file a class-action lawsuit against 30 brokerage firms, including Merrill Lynch, Goldman Sachs and Morgan Stanley, which agreed in 1997 to pay about $900 million in what was called at the time the biggest settlement ever of a price-fixing lawsuit.
What is Transaction Cost Analysis?
What the researchers behind the article have provided is part of what is known nowadays as Transaction Cost Analysis (TCA). Transaction costs have become a relevant issue in Europe for example since 2007 with the implementation of MiFID (Markets in Financial Instruments Directive). The introduction of the best execution obligation gave TCA a central role, aiming for investment firms to “take all reasonable steps to obtain the best possible result when executing orders for their clients”. Moreover, MiFID’s Article 21 of Level 1 and Article 45 of Level 2 require investment firms to provide their clients with “appropriate information” about their execution policies. Clients wishing to select a firm to deal with from among a competing group need to have sight of the relevant firms’ execution policies in order to evaluate whether a particular investment strategy is suitable. By requiring ex-ante disclosure of the execution policy, MiFID addresses clients’ information needs; they should always be able to pay the lowest possible net cost (or receive the highest possible net proceeds).
Transaction Cost Analysis (TCA) is the study of trade prices to determine whether trades are arranged at favourable prices (low prices for purchases and high prices for sales). The difference between the cost of the transaction at the time the manager decided to execute it and the actual cost is at the heart of TCA, including all operating charges, spreads, commissions and fees. The resulting differential is called “slippage”.
There are usually 9 components identifiable when dealing with transaction costs, they can be classified as per the following chart:
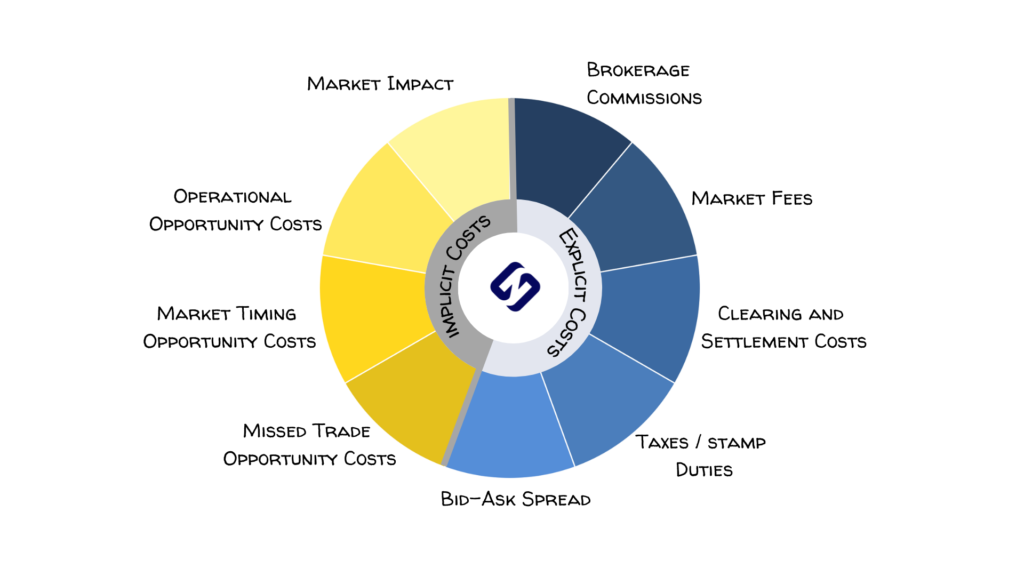
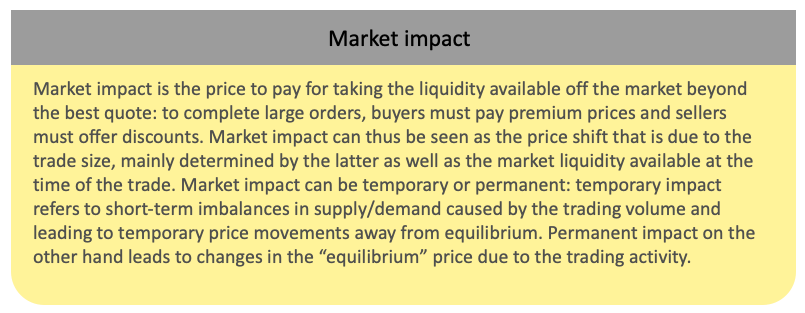
Implicit transaction costs:
Market Impact and various Opportunity costs detailed as follows:

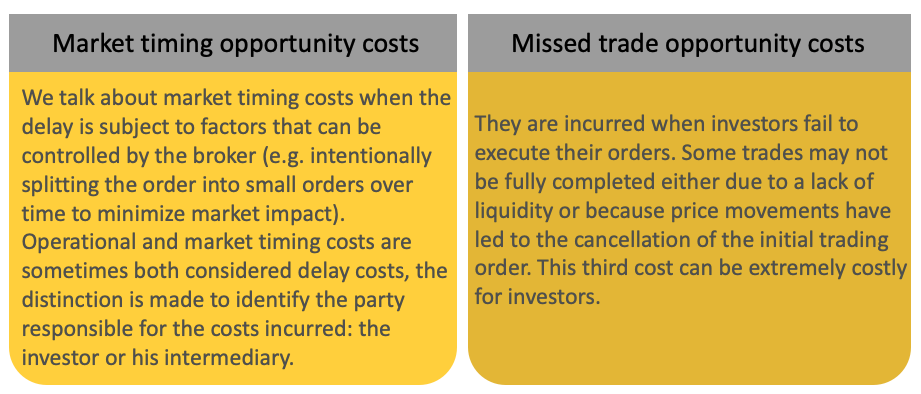
Explicit transaction costs:
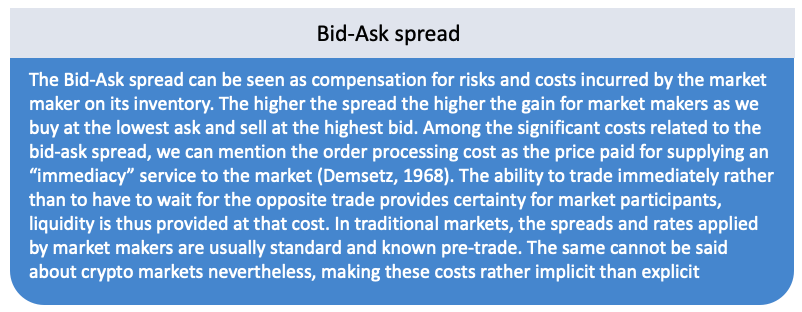
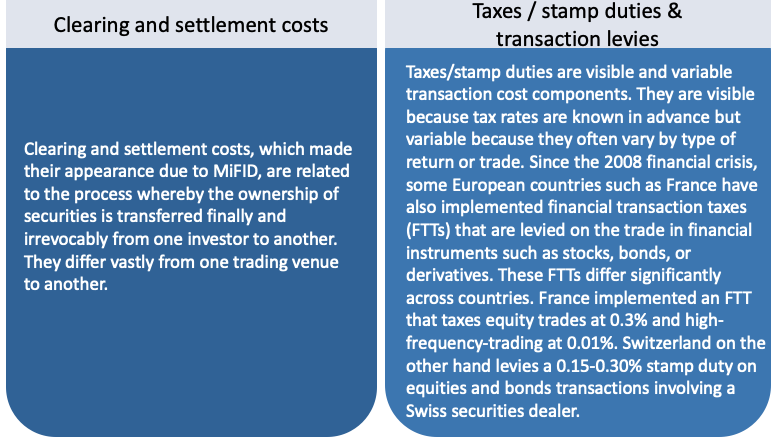
Brokerage Commisions, Market fees, Clearing and Settlements costs, Missed Trade opportunity costs, Bid-Ask spread detailed as follows:
Conclusion
The same transaction costs exist for crypto trading as well but suffer from a severe lack of transparency. The Markets in Crypto-assets (MiCA) regulation in its latest version comes however with a “best execution” obligation that should force digital assets service providers down the same path as their TradFi peers. This obligation should come with extensive quantitative analytics of order execution prices, leading to increased competition among trading venues and liquidity providers. When that day comes, institutional and retail crypto investors should be able to rely on Sun Zu Lab’s advanced and completely independent liquidity analytics to provide much-needed transparency to the crypto ecosystem.
In the next part of this article to be published, we will look at pre and post-trade TCA and analyse how this process actually works and how it helps an investment manager save money.
Questions about this article can be addressed to research@sunzulab.com or c.eladnani@sunzulab.com
Sources:
- “Why do Nasdaq Market Makers Avoid Odd-Eighth Quotes?” by William G. Christie and Paul H. Schultz, https://www.jstor.org/stable/2329272
- “Why did Nasdaq Market Makers Stop Avoiding Odd-Eighth Quotes?” by William G. Christie, Jeffrey H. Harris and Paul H. Schultz, https://www.jstor.org/stable/2329273#:~:text=On%20Thursday%20May%2026%2C%20the,quotes%20for%20active%20NASDAQ%20stocks.
- 30 Firms to Pay $900 Million In Investor Suit: https://www.nytimes.com/1997/12/25/business/30-firms-to-pay-900-million-in-investor-suit.html
- EDHEC research publication, https://risk.edhec.edu/sites/risk/files/EDHEC_Publication_Transaction_Cost_Analysis_A-Z.pdf
About SUN ZU Lab
SUN ZU Lab is a French Fintech that aims to become the leading independent provider of digital asset market quantitative analytics tools and services. Leveraging the founding team’s 70+ years of experience in international capital markets and trading technology, SUN ZU Lab provides crypto professionals with unprecedented liquidity analytics in the form of quant reports, dashboards, real-time augmented data feeds, and bespoke studies.

