This website uses cookies so that we can provide you with the best user experience possible. Cookie information is stored in your browser and performs functions such as recognising you when you return to our website and helping our team to understand which sections of the website you find most interesting and useful.
Market Making: Guidebook to Crypto Foundations & Token Issuers
By Stéphane Reverre & Chadi El Adnani @SUN ZU Lab
February 2024
[NB: See the glossary at the end of the article for a definition of technical terms]
Liquidity(*) is the gasoline of any exchange, whether traditional or crypto, and the engines pumping it are called Market Makers. We have provided in a previous article a rather technical view on the subject. Today’s approach targets a broader non-technical, non-financial audience, with a focus on token foundations and issuers.
Questions and comments can be addressed to c.eladnani@sunzulab.com or research@sunzulab.com.
What is Market Making (MM)? The case of the used car market:
Say you are looking for a car, and quite naturally, end up at your local dealership. Under normal circumstances, the salesman can offer a brand-new vehicle, or a used one. Those prices are “offered” prices: the salesperson is selling/you are buying.
Done deal: you get a used car, but unfortunately, realize 5 months later that it really doesn’t do the job. Too small, too big, whatever it is, you go back to the salesperson: “Hello, I bought a car from you 5 months ago, and it is not quite what I need. Can I sell it back?”. At this point, you may receive two different answers:
i/ “Sorry, I don’t have a buyer; let me call you back when I do.” In that case, you will be able to sell when a buyer comes along, not before. You may also look for a buyer yourself.
ii/ “Yes, of course, I’ll take it from your hands at …”. This price is a bid price i.e., the dealership is buying/you are selling.
The bid price will be lower than the original offer for obvious reasons (you drove the car for 5 months). Now, let’s assume, for the sake of the discussion, that you go back the day after your purchase. Will the salesperson bid the same price they offered the day before? Probably not. A bid will be lower than the offer price, if it is forthcoming.
The difference between bid and offer (also called the “ask” or “asking” price) is called the “spread”(*). In practice, this is the minimum profit margin the dealership will want to secure to offer the used car service. This margin exists for a number of reasons, but most notably because the dealership is taking a financial risk in carrying an inventory of used cars. Bottom line: the bid-offer spread is necessary to remunerate a risk. This is why even if you bring the car the next day, you will not get the offer price: the dealer takes a risk by accepting the car back, and a profit will be needed to pay for that risk.
Market Making in Finance:
The SEC defines a market maker as “a firm that stands ready to buy or sell a stock at public quoted prices.” A market maker (MM) is a professional trader who actively quotes two-sided markets in a particular asset, providing Bids(*) and Asks(*) for a given quantity.
There is, in practice, no difference between a financial MM and a car dealership (no kidding). The difference is in the asset: contrary to cars, stocks are fungible (i.e., perfectly identical for a given issuer), not subject to wear and tear, and not continuously produced, which means that the “second hand” market is very active (you cannot get a “brand new” share).
A car dealership will always provide an offer price for a new car because it is its primary business, the one from which it derives most of its revenues. The fact that it would provide a bid price for a used car depends on a number of factors, and no dealership will consider that it has an obligation to do so. To be clear, selling new cars doesn’t create a financial risk: the dealership takes a deposit, orders the car, and delivers it against payment when the manufacturer has shipped. Buying a used car means getting cash out, with the risk of getting stuck with a car that nobody wants.
Like the dealership, a MM may choose to participate in the market at all times or not, buying assets from sellers and selling them to buyers. MMs’ primary mandate is to provide liquidity, which ensures investors can trade quickly and at a fair price in all conditions. This creates a win-win situation where the MM earns profits for its services, and the overall market enjoys a certain level of liquidity, price stability and confidence. Evidently, MMs that decide to participate at all times carry a larger financial risk than those that do not. For a dealership, the level of financial risk is captured by the inventory of used cars waiting to be sold. This is exactly the same thing for the financial MMs.
It is essential to note that MMs have a mandate to provide liquidity (i.e. help investors trade better), but not to move the price. This is achieved by keeping MM obligations symmetric, with a bid AND offer price published simultaneously and a maximum spread, in all market conditions. Obviously, if a MM is stuck with too much inventory, its risk management may push for liquidation, which in turn may impact the asset price. However, this impact is not a primary result of the MM intervention; it is a consequence of adverse risk conditions (even if the risk results from poor management). Ideally, a car dealership will want to buy and sell used cars so quickly that its inventory remains near zero as often as possible. It’s the same thing for a financial MM: trading is rapid on both sides of the spread, and inventory is null at the end of every day.
In real life, two situations occur: extremely liquid assets/tokens that can be easily bought or sold without causing significant price impact, and less liquid assets/tokens that experience substantial price swings every time a sizeable trade is executed. MMs are extremely useful in the second case.
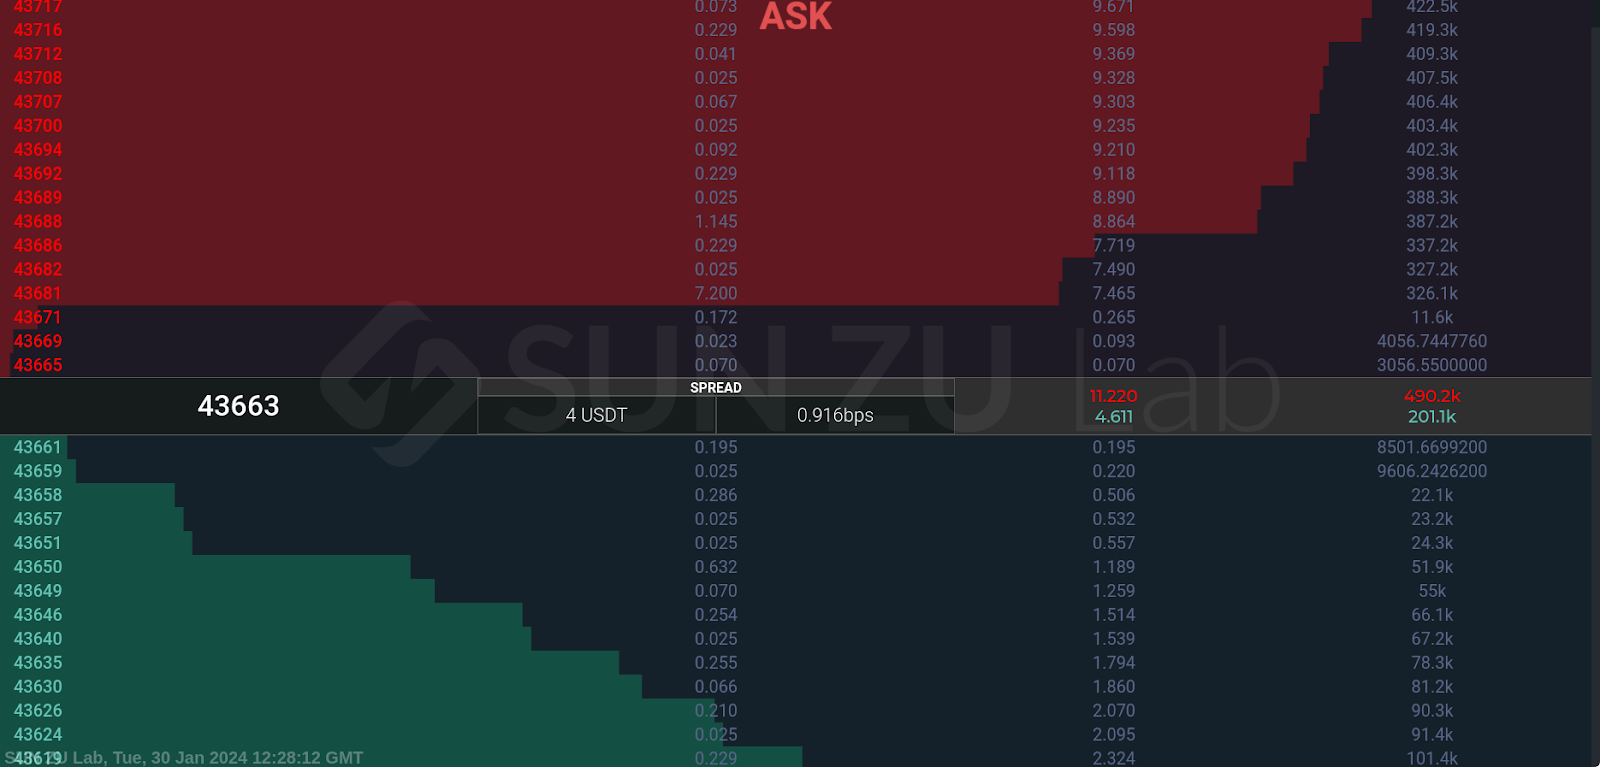
Liquid asset: BTC-USDT on Bitstamp
Source: SUN ZU Lab Live Monitoring Dashboard
Let’s take Bitcoin (BTC) as an example of a very liquid asset. The lowest number in red represents the best Ask/Offer (the lowest price at which sellers are willing to sell, on this specific exchange, at the moment). In contrast, the highest number in green represents the best Bid (the highest price buyers are willing to offer for Bitcoin), the difference between the two is the Bid-Ask spread (4 USDT or 0.916 bps). We can see on the last column (cumulative $ USDT sell/buy order amounts at each level) that a $11K (USDT) spot buy order would leave the best Ask at 43,671 USDT, moving the mid-price by a mere 3 USDT to 43,676, and the new spread to 10 USDT or 2.3 bps. This would be a temporary situation as market participants would move quickly to fill this gap and bring the spread back to previous levels.
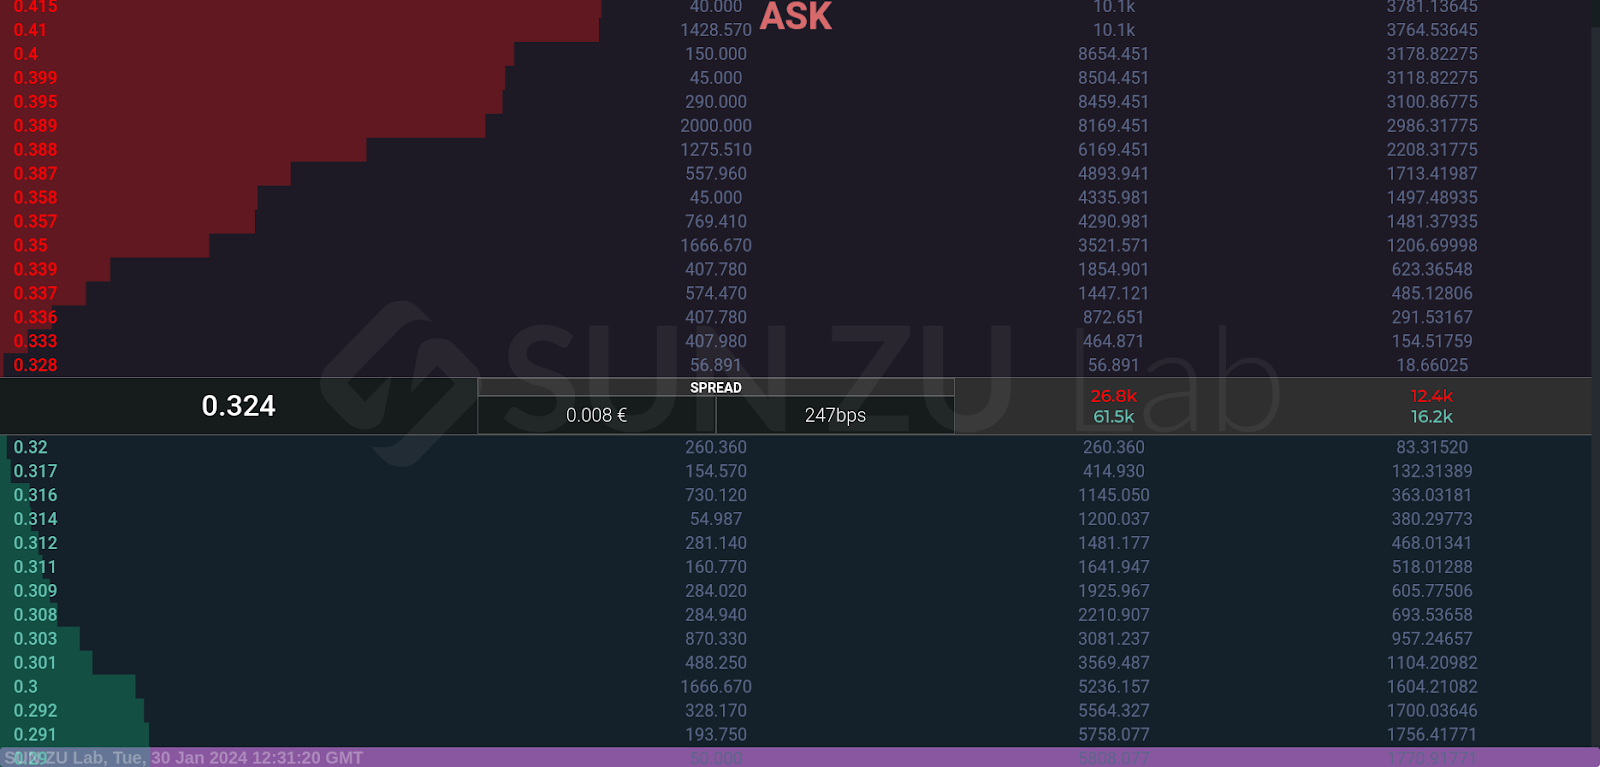
Illiquid asset: POLIS-EUR on Kraken
Source: SUN ZU Lab Live Monitoring Dashboard
In the case of POLIS-EUR as an example of an illiquid asset, a €1000 sell order would move the best Bid down to €0.301, creating a €0.027 spread, or a whopping 8.6%!
The business of Market Making:
In TradFi, there are situations where market-making is voluntary and optional, and others in which it is self-imposed or even constrained by a contract. There are, for example, many hedge funds running “statistical arbitrage” strategies that are akin to voluntary market-making. The strategy stands ready to buy and sell in the market with a certain spread, and doing so will (hopefully) generate trading profits without too big an inventory. But if you want to become a registered MM with certain privileges, you must commit to continuously quoting prices. Examples of that abound in Europe; most electronic exchanges have MM programs for specific products: in exchange for a commitment to provide liquidity, MMs will enjoy reduced fees or sometimes outright payments. Under those commitments, MMs must quote a minimum volume at a maximum spread, and stick to those parameters at all times and during all market regimes.
When MMs operate under a contract with an exchange, they will often benefit from specific technical provisions: typically, the exchange will implement a “market maker protection,” which essentially cancels all orders (at once) from a MM when violent price moves occur. There are also different modalities for order management (for example, a “bulk order” capability, whereas regular investors can only send single orders, one at a time). Those features incentivize MMs to stay in the market even when volatility rises (i.e., when they are most needed) by offering privileged risk management tools.
As an industry, market makers earn the ‘spread’ between bid and ask prices because they accept to carry inventory risk. When the spread is contractually set, their profit margin is mechanically constrained.
In today’s highly competitive markets, the bid-ask spread is often razor thin (0.1 to 1 bp for Bitcoin on leading centralized exchanges). To remain profitable, a market maker must price assets quickly and accurately, be able to execute trades at scale, and manage its inventory properly.
Inventory risk is indeed the most important risk here. You have to have some to fulfill your obligations (what if a buyer comes asking for some?), and yet it is subject to price movements. Too much of it will cost if prices are going down, and too little may prevent you from fulfilling investors’ demands. Incidentally, this risk is even more pronounced in crypto markets, where prices are more volatile.
The Importance of Market Making:
Liquidity & Depth
Market makers make it easier for investors to buy or sell an asset quickly or in large volumes. In financial terms, they deliver liquidity and depth to the market.
Attracting and concentrating the asset’s tangible volume is crucial – as opposed to engaging in practices like wash trading (*), layering or spoofing(*), which attempt to create fake or misleading volume. This distinction is significant in maintaining ethical financial practices and building investors’ trust. Market makers play a vital role in this, as their ability to optimize liquidity directly impacts the organic volume and, in the end, investors’ confidence.
Insuring New Token Launch Success
New tokens are usually not widely known after their initial listing on exchanges and may suffer from a limited community of buyers and sellers, making it challenging for market participants to find each other and agree on a price. This is where MMs are extremely important to tighten the spreads, buying from sellers and selling to buyers at prices they both deem fair and acceptable. We covered in a previous article how the Worldcoin team relied on five MMs during the launch phase to ensure “sufficient liquidity for WLD traded on centralized exchanges outside the US, to facilitate price discovery, and to enhance price stability of WLD.”
Greater Price Stability and Lower Volatility
Market makers’ presence streamlines the execution of trades, reduces fluctuations in prices, and dampens supply and demand gaps. These activities build confidence among market participants. Market makers help ensure that markets function reliably and remain resilient even during times of turbulence.
Enforcing Price Coherence across Venues and Products
Crypto market makers can play a role in mitigating price discrepancies between different exchanges or instruments. They continuously quote buy and sell prices across different venues and related instruments, thereby strengthening market integration.
How to choose your crypto Market Maker:
Because of their role in providing liquidity, MMs have an important role to play in the crypto ecosystem. Yet, bulletproof standards have not found their way into the marketplace, and stakeholders are not necessarily well protected – without even being aware of it. When choosing a MM to contract with, the most important questions are often those that are not even on the table. You know, the old adage: “What should I ask that you are not telling me?”
Here are, in our views, a few important considerations and certainly questions for which you should be getting answers – or your money back:
- Consistent spreads & deep order books: “How do I know that you are in the market when you are needed and at the very least when you are supposed to?”. We view this as the single most important question a MM should answer. There are four fundamental characteristics of a well-formed MM contract: size, spread, time, and symmetry. A professional MM will provide prices for a given symmetric size and maximum spread with a minimum presence (say 90% of the time, measured with 12- or 24-hour intervals). Token issuers often do not have the financial knowledge to assess MMs’ actual impact on liquidity. MMs provide reporting on their activity, but isn’t that the left hand evaluating the right one? An independent assessment is the best way to go, and any serious MM will agree and diligently accept third-party assessment of contractual KPIs. Today, few actors in crypto are able to provide transparency on whether Market Makers are actually doing their job – SUN ZU Lab was created to answer that question.
- Risk management: “How do you manage your inventory?” MMs have full latitude to manage their risk as they see fit, but accumulating undue inventory may create tremendous selling pressure if liquidation occurs suddenly. In fact, it’s a double whammy: if a sharp fall in price forces a MM to liquidate a sizeable inventory, it will only add to the overall sentiment of panic. Best practice suggests an inventory risk under control and within reasonable limits (whatever they are). As a token issuer, you don’t care about MMs inventories, but certainly, you care about the possibility of a massive downward shock if those inventories accumulate too much or too fast.
- Reputation and business ethics: “How do I know that you will not engage in manipulation or other deceptive practice at the expense of token holders?” Well, crypto being unregulated, MMs can do on the side whatever they want. But at the very least the issue of reputation and fairness should be put on the table, and commitments should be made.
- Profitability: “How much trading profit do you make?” This one is a hard transparency question, and not all MMs may want to answer. Being constrained, a MM may not always make a trading profit. On average though, trading profit plus contractual remuneration should add up and be positive. Yet, too much profit means that the contract is unbalanced.
Glossary:
- Market Maker (MM): The SEC defines a market maker as “a firm that stands ready to buy or sell a stock at public quoted prices.” A market maker (MM) is a professional trader who actively quotes two-sided markets in a particular asset, providing bids and asks for a pre-defined quantity.
- Bid: The highest price a buyer is willing to pay to purchase a security or financial instrument. It represents the demand side of the market, and market makers provide bid prices at which they are willing to buy securities from potential sellers.
- Ask: The lowest price at which a seller is willing to sell a security or financial instrument. It represents the market’s supply side, and market makers provide ask prices at which they are willing to sell securities to potential buyers.
- Bid/Ask Spread: The difference between the highest price (bid) a market maker is willing to pay for a security or financial instrument and the lowest price (ask) at which they are willing to sell. From an investor viewpoint, the spread represents the cost of trading while it can be seen as a (maximum) profit margin for market makers.
- (Market) Liquidity: Is defined as the ability to buy or sell large quantities of an asset without significant adverse price movement.
- Market Depth: The measure of the quantity of buy and sell orders at different price levels for a security or financial instrument. Market makers closely monitor the market depth to assess supply and demand dynamics, adjust their bid and ask prices accordingly.
- Order Book: A digital record of all outstanding buy and sell orders for a security or financial instrument, organized by price level. Market makers use the order book to gauge market sentiment and make pricing decisions.
- OTC (“over the counter”): refers to a type of trading where parties negotiate terms privately. It is opposed to an “organized market” where trading is governed by standardized instruments and rules, and trading is often anonymous.
- Quote: A market maker’s bid and ask prices for a security or financial instrument. Quotes are typically displayed on electronic trading platforms and reflect the market maker’s willingness to buy or sell at those prices (for a given quantity).
- Arbitrage: The practice of taking advantage of price discrepancies in different markets or instruments to make a risk-free profit. Market makers may use arbitrage strategies to capture slight price differences between trading venues or related securities.
- Wash trading: A form of market manipulation in which an entity simultaneously sells and buys the same financial instruments, creating a false impression of market activity without incurring market risk or changing the entity’s market position.
- Spoofing: A term used to describe a form of market manipulation where traders place a Bid or Ask order with no intention of fulfilling it, instead canceling it before execution, with the sole intention of manipulating markets in a certain direction (up or down).
Disclaimer
No Investment Advice
The contents of this document are for informational purposes only and do not constitute an offer or solicitation to invest in units of a fund. They do not constitute investment advice or a proposal for financial advisory services and are subject to correction and modification. They do not constitute trading advice or any advice about cryptocurrencies or digital assets. SUN ZU Lab does not recommend that any cryptocurrency should be bought, sold, or held by you. You are strongly advised to conduct due diligence and consult your financial advisor before making investment decisions.
Accuracy of Information
SUN ZU Lab will strive to ensure the accuracy of the information in this report, although it will not hold any responsibility for any missing or wrong information. SUN ZU Lab provides all information in this report and on its website.
You understand that you are using any information available here at your own risk.
Non Endorsement
The appearance of third-party advertisements and hyperlinks in this report or on SUN ZU Lab’s website does not constitute an endorsement, guarantee, warranty, or recommendation by SUN ZU Lab. You are advised to conduct your due diligence before using any third-party services.
About SUN ZU Lab
SUN ZU Lab is a leading data solutions provider based in Paris, on a mission to bring transparency to the global crypto ecosystem through independent quantitative analyses. We collect the most granular market data from major liquidity venues, analyze it, and deliver our solutions through real-time dashboards & API streams or customized reporting. SUN ZU Lab provides Token Issuers & Market Makers with institutional standard actionable data solutions to improve the transparency and fairness of Crypto markets.
Market Making Overview: TradFi vs Crypto
By Stéphane Reverre & Chadi El Adnani @SUN ZU Lab
June 2023
Link to PDF version
Market Making Overview: TradFi vs Crypto – SUN ZU Lab
[NB: See the glossary at the end of the article for a definition of technical terms]
Liquidity(*) is the gasoline of any exchange, whether traditional or crypto, and the engines pumping it are called Market Makers. We define them in this article and go over their role, strategies, and risks, as well as a thorough comparison between market making in Tradfi and crypto.
We have already provided in-depth detail about TradFi and crypto market liquidity here, and why liquidity has become a question of survival for crypto venues here, so let us dive right into the nitty-gritty of market making.
Questions and comments can be addressed to c.eladnani@sunzulab.com or research@sunzulab.com.
Market Making in TradFi
Historically, cash equity markets used to execute auctions manually to match buyers and sellers, and it could take seconds to fill a marketable order. Today, they are mainly electronic, with trading occurring on fully-automated exchanges and dark pools. In contrast, fixed Income markets remain primarily dealer-driven and over-the-counter (OTC)(*), in many cases still trading via person-to-person telephone interactions – although electronic trading is taking ground under regulatory pressure. Contrary to equities, foreign-exchange (FX) markets are dominated by a handful of the world’s largest banks and market-making firms, who stand ready to provide two-sided markets and liquidity even when central banks intervene, driving periods of high market volatility.
Registered market makers (MM)(*) generally provide transparent two-sided bid-ask(*) quotes at all times when a market is open, meaning that MMs will publish a price and amount that they are willing to buy or sell at throughout the trading session. In fact, Reg NMS(*) requires that registered MMs provide firm quotes immediately accessible to incoming orders. They are also usually constrained to maintain spreads below a maximum limit, a minimum order book depth and presence in the order book a minimum duration within trading sessions (the uptime requirement). As a result, MMs collect trading profits from their activity, in addition to incentives (for example, rebates against regular trading fees) offered for displaying orders at certain venues (from exchanges or issuers who want to maintain adequate liquidity). Liquidity providers are mostly passive in the order book, but they may occasionally aggressively take liquidity in some circumstances to manage their risk and inventory.
It is essential to note that MMs have a mandate to provide liquidity (i.e. help investors trade better), but absolutely not to move the price. This is achieved by keeping the MM obligation symmetric, with a bid AND ask price at the same time and a maximum spread to make sure MM prices are not too far from the actual price.
In the US, for example, the regulatory requirement is that the Designated Market Maker (DMM) must always be willing to buy or sell one round lot (usually 100 shares). They are further required to quote at the National Best Bid or Offer (NBBO) at least 15% (10%) of the trading day for securities trading over (under) 1,000,000 shares per day. When they are not at the NBBO, their quotes can be at most 8% away for stocks in the S&P 500 or Russell 1000 indexes. For other stocks, the maximum amount their quotes may be away from the NBBO is 28% for stocks trading at or over $1 and 30% otherwise. Market making obligations are only active during regular trading hours (9:30 AM – 4:00 PM) on most days: market makers are not required to quote outside these time frames.
On the European markets operated by NYSE/Euronext, there are two types of market makers – auction or permanent. The former add liquidity for stocks only traded through call auctions and the latter for stocks traded continuously. Auction market makers (also called “liquidity providers”, LP), are only required to maintain a spread during the order collection phase of each auction. The maximum spread width for both market makers is between 2% and 5% (€0.10 and €0.25) for stocks trading above (at or less than) €5. Euronext LPs obtain a reduction in fees and may receive side payments from the companies they trade. Such a payment occurs under a “liquidity contract”, under which a market maker receives a pre-agreed remuneration from the issuer to maintain a certain liquidity. Trading profits (and/or losses) are usually carried by the issuer (i.e. the market maker is insulated from market risk).
Market Making in TradFi overall is a heavily regulated and transparent business; regulators surveil MMs to ensure they comply with their obligations. Regulators (or exchanges) can impose both positive and negative obligations on market makers, requiring them to provide liquidity to the market or preventing them from executing a trade if a retail order could execute instead of it, for example. For example, EUREX (a European derivatives exchange) states here the specifics of Regulatory Market-Making, according to MiFID II, and Commercial Liquidity Provisioning on its platform. In practice, MMs sign a contract with exchanges, and the list and details of contractual MMs are public for everyone to see. The idea is that an investor looking for liquidity may directly contact a MM.
Market Making strategies, risks & examples
Here is an overview of the most common market making strategies in TradFi:
Delta Neutral Market Making: A market maker seeks to self-hedge against the inventory risk and wants to offload it in another trading venue. For that, a MM would place limit orders on an exchange with low liquidity, and when those are filled, immediately send a market order (on the opposite side) to an exchange with higher liquidity.
High-frequency “at touch” Market Making: A common strategy for MMs is submitting limit buy/sell orders at the best bid/ask prices. The MMs bid/ask order spread is then equal to that of the limit order book (LOB). Sometimes, MMs will submit orders at prices marginally higher than the bid and lower than the ask to gain order execution priority. However, this is only possible when spreads are not already very tight. Alternatively, a market maker could place their orders further into the LOB queue (lower bid and higher ask). This strategy produces higher margins but also a lower order execution rate.
Last Price: In this case, MMs will reference the last price a security traded at when placing their bid/ask quotes, submitting bid/ask orders one or two ticks away in either direction. This strategy provides a higher return than the “at touch”; however, this comes at the expense of higher end-of-day inventory of the given security.
Grid Market Making: In this case, a market maker places limit orders throughout the book, of increasing size, around a moving average of the price, and then leaves them there. The idea is that the price will ‘walk through’ the orders throughout the day, earning the spreads between buys and sells.
These strategies work well when prices are relatively stable but may lose money heavily during sustained momentum or volatility periods. When prices keep going up, the MM will find it extremely difficult to execute bid orders, accumulating an increasingly significant losing-money short position, and the same applies in the opposite direction. MMs should pay close attention to market volatility and order book imbalances to avoid being trapped in such situations.
According to studies published in 2014 and 2021, market makers are likely to reduce their market participation in periods of significant volatility. MMs often farther into the LOB in such situations to avoid being caught out by significant and abrupt changes in the market, reducing liquidity and potentially making markets even choppier. In addition to reduced trading volumes in periods of volatility, MMs will adjust their quoting price based on movements in the order book, monitoring the LOB for any order imbalances. For example, MMs will adjust their ask/bid quotes if the volume difference between bid and ask quotes grows, expecting an uptrend in price movements.
It is also interesting to note that when MMs operate under a contract with an exchange, they will often benefit from specific technical provisions: typically, the exchange will implement a “market maker protection” which essentially cancels all orders (at once) from a MM when violent price moves occur. There are also different modalities for order management (for example, a “bulk order” functionality, whereas regular investors can only send single orders, one at a time). Those features act as an incentive for MMs to stay in the market even when volatility rises (i.e. when they are most needed) by offering specific risk management tools.
All else equal, strategies accounting for order book imbalances increase returns and end-of-day inventory. Those adjusting the bid/ask quote for volatility will also increase returns while decreasing inventory. These two strategies are hence often combined to achieve optimal performance.
One of the most significant risks of market making is the inventory risk. MMs have to store a particular amount of assets to fill a buy/sell order, and the inventory risk manifests itself every time markets start forming a trend (upwards or downwards) for a sustainable period. The inventory risk in a scenario of decreasing prices results in the risk of having more of an asset at the wrong time, with difficulties to find buyers to unwind it. This risk is vastly larger in crypto markets, where prices are more volatile.
To illustrate the above, let us give a quick example of how a basic market-making trade takes place, a MM active on a stock X shows a bid and ask price with a quote of $10.00 – 10.05 (not necessarily the same bid and ask volumes). This means that the MM is willing to buy X stocks for $10.00 and sell them at $10.05, earning a spread of 5 cents per share (in the absence of market movement, this is indeed a maximum gain). If everything goes well, the MM could buy and sell 10,000 shares at these quotes, earning $500 from this trade.
If, on the contrary, a large sell order takes place, the MM could find itself long Y shares with the best ask down to $99.95, for example. The MM is faced with the choice to hold its position if it believes prices will reverse higher, post an order to sell at $99.95, or even choose to simply trade out of the position by selling to the prevailing highest-priced buy order, locking in a trading loss.
Crypto Market Making
The market making business in the crypto space has little to do with its older, more established counterpart in TradFi. After 14 years, crypto markets are still in a “far west” state. It is not an exaggeration to say that exchanges are far from mature, from both a technical and regulatory standpoint: liquidity is low (to very low), highly concentrated on a few instruments, slippage risks are high, manipulation is frequent, and there are clear probabilities of flash crashes when large orders appear.
Market Making agreements in crypto are also different from TradFi in many aspects, mainly:
- High engagement fees: Market makers with an established name may require payments as high as $100,000 for setup fees, $20,000 monthly fees, and a $1 million BTC and ETH loan.
- Asymmetry in pay structure: The use of options (see below) creates a situation where MMs have an incentive to manipulate the price of the token. This is absolutely illegal in TradFi.
- Imbalanced deals: Token issuers had historically little negotiation room with MMs due to the uncertainty around traded volumes after listing, leading to deals mainly favoring MMs. It’s a chicken-and-egg problem: no MM means little liquidity and little liquidity means little negotiating power vis-à-vis MMs demands.
- Little to no measurement or performance: token issuers are tech-savvy but often have insufficient financial knowledge to assess actual MMs impact on liquidity. In contrast, TradFi exchanges produce quantitative assessments of liquidity provisions, and can end liquidity contracts for insufficient performance or poor compliance with stated KPIs.
- Bad actors: Crypto’s lack of regulation has attracted all sorts of fraudulent players that engage in deceptive activities such as wash trading, spoofing, or misuse of token loans.
The terms of the market-making agreement, also known as the Liquidity Consulting Agreement (LCA), often evolve around compensation: MMs will receive financial incentives to reward improvements in a token’s liquidity and market value. Typical components are service fees, options, or KPI-based fees:
- Service fees: They usually involve initial setup fees to the MM at the beginning of the agreement, recurring (monthly or quarterly) retainer fees, or no fees in times of raging bull markets when hyped tokens become profitable enough for MMs to trade (without any other sort of compensation).
- Call Options: They provide the MM with financial upside when the token’s price rises, incentivizing them to try and keep the price above a specific strike price. The use of options aligns the founders’ interests with the MM’s, but at the expense of a fair and efficient market because of the embedded incentive to artificially manipulate the token’s price. This was particularly common in bull markets when the frenzy for new tokens pushed MMs to negotiate options in their package. Due to MMs’ vastly superior financial expertise compared to token founders, using options in a MM deal is the perfect opportunity to leverage the information asymmetry and increase the MM’s value creation on the back of the token community. The use of call options is utterly absent from TradFi because it creates an incentive to manipulate the price and pump it up.
- Performance-based fees: These fees can be paid if certain thresholds are reached (volume, price, spread…). Such fee agreements are dangerous to implement as they can (also) encourage malpractices like wash trading.
- Token Loans: MMs cannot sell what they do not own. To show ask prices and sell tokens, they have access to a reserve of tokens. That reserve is usually provided free of charge by the token ecosystem from the token pool issued but not yet available to the public. There is naturally the risk that MMs cannot return the tokens and that risk should naturally be explicitly covered in the agreement.
Examples of such crypto market making agreements are public and can be found here or here.
Crypto markets also bring the question of CEXs vs DEXs market making. Market making on centralized exchanges is similar in principle to what professional firms do in Tradfi. Another critical concept is the difference between “maker” and “taker” orders. The former refers to orders where the buyer or the seller defines a price limit at which they are willing to buy or sell. Taker orders, by contrast, are orders that are executed immediately at the best bid or offer. Thus, maker orders add liquidity, and taker orders remove it. Crypto market makers must be meticulous when managing their inventory to not pay excessive taker fees (example of the fee structure on Coinbase).
Regarding market making on DEXs, we previously highlighted the process of price discovery in DeFi protocols, taking the example of liquidity pools in Automated Market Makers (AMMs) with a focus on Uniswap (qualitative and quantitative analysis).
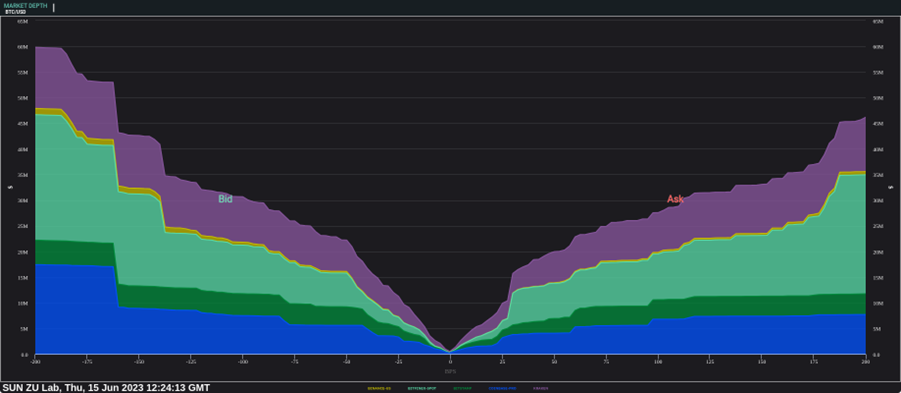
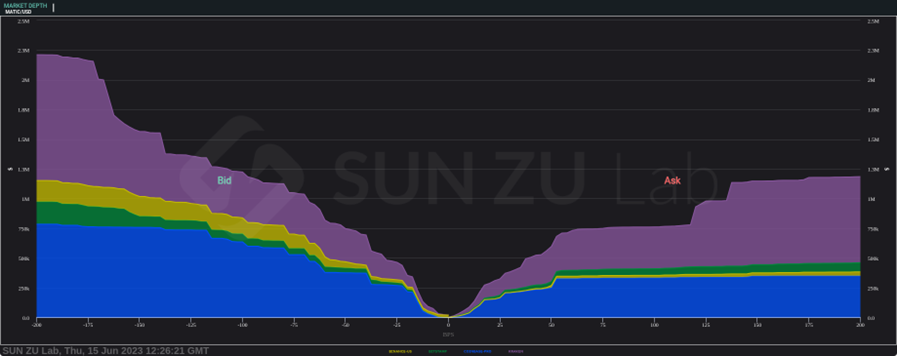
Market depth comparison between BTC/USD (~$60m/$45m bid/ask volume at 200 bps) and MATIC/USD (~$2.3m/$1.3m bid/ask volume at 200 bps), on Binance.Us, Bitstamp, Coinbase-Pro, Kraken and Bitfinex
Source: SUN ZU Lab Live Dashboard
Glossary:
- Market Maker (MM): The SEC defines a market maker as “a firm that stands ready to buy or sell a stock at public quoted prices.” A market maker (MM) is a professional trader who actively quotes two-sided markets in a particular asset, providing bids and asks for a pre-defined quantity.
- Alternative Trading Systems (ATS): also known as dark pools, are private marketplaces where investors place buy and sell orders without the venue disclosing its order book (i.e. available prices or volumes it has received from investors).
- Bid: The highest price a buyer is willing to pay to purchase a security or financial instrument. It represents the demand side of the market, and market makers provide bid prices at which they are willing to buy securities from potential sellers.
- Ask: The lowest price at which a seller is willing to sell a security or financial instrument. It represents the market’s supply side, and market makers provide ask prices at which they are willing to sell securities to potential buyers.
- Bid/Ask Spread: The difference between the highest price (bid) a market maker is willing to pay for a security or financial instrument and the lowest price (ask) at which they are willing to sell. From an investor viewpoint, the spread represents the cost of trading while it can be seen as a (maximum) profit margin for market makers.
- (Market) Liquidity: is defined as the ability to buy or sell large quantities of an asset without significant adverse price movement.
- Market Depth: The measure of the quantity of buy and sell orders at different price levels for a security or financial instrument. Market makers closely monitor the market depth to assess supply and demand dynamics, adjust their bid and ask prices accordingly.
- Order Book: A digital record of all outstanding buy and sell orders for a security or financial instrument, organized by price level. Market makers use the order book to gauge market sentiment and make pricing decisions.
- OTC (“over the counter”): refers to a type of trading where parties negotiate terms privately. It is opposed to an “organized market” where trading is governed by standardized instruments and rules, and trading is often anonymous.
- Quote: A market maker’s bid and ask prices for a security or financial instrument. Quotes are typically displayed on electronic trading platforms and reflect the market maker’s willingness to buy or sell at those prices (for a given quantity).
- Arbitrage: The practice of taking advantage of price discrepancies in different markets or instruments to make a risk-free profit. Market makers may use arbitrage strategies to capture slight price differences between trading venues or related securities.
- Regulation National Market System (Reg NMS): a set of rules passed in 2005 by the SEC that sought to refine how all listed US stocks are traded. The intention was to boost transparency by improving the displaying of quotes and access to market data and ensuring that investors get the best price on their orders.
- Regulation of Exchanges and Alternative Trading Systems (Reg ATS): became effective in 1999 and was set by the SEC to regulate trading activities on ATS.
Disclaimer
No Investment Advice
The contents of this document are for informational purposes only and do not constitute an offer or solicitation to invest in units of a fund. They do not constitute investment advice or a proposal for financial advisory services and are subject to correction and modification. They do not constitute trading advice or any advice about cryptocurrencies or digital assets. SUN ZU Lab does not recommend that any cryptocurrency should be bought, sold, or held by you. You are strongly advised to conduct due diligence and consult your financial advisor before making investment decisions.
Accuracy of Information
SUN ZU Lab will strive to ensure the accuracy of the information in this report, although it will not hold any responsibility for any missing or wrong information. SUN ZU Lab provides all information in this report and on its website.
You understand that you are using any information available here at your own risk.
Non Endorsement
The appearance of third-party advertisements and hyperlinks in this report or on SUN ZU Lab’s website does not constitute an endorsement, guarantee, warranty, or recommendation by SUN ZU Lab. You are advised to conduct your due diligence before using any third-party services.
About SUN ZU Lab
SUN ZU Lab is a leading data solutions provider based in Paris, on a mission to bring transparency to the global crypto ecosystem through independent quantitative analyses. We collect the most granular market data from major liquidity venues, analyze it, and deliver our solutions through real-time dashboards & API streams or customized reporting. SUN ZU Lab provides crypto professionals with actionable data to monitor the market and optimize investment decisions.
Index Liquidity: what does it mean?
Indexing has been a popular strategy on traditional markets, indeed recent history shows index funds and ETFs have received massive inflows and registered a growth in assets superior to actively managed funds.
Thus it is no surprise that indexing is starting to emerge on digital assets. It is a way for investors to diversify their exposure away from the most heavily traded assets while keeping a rigorous methodology to avoid arbitrary decisions. Trakx is a leading provider of such indexing solutions.
However, investing under an indexing strategy doesn’t necessarily mean more liquidity. Indeed an index is often nothing more than the sum of its parts. Assessing index liquidity means therefore looking in-depth at the underlying basket. This is our specialty at SUN ZU Lab, and the purpose of this article is to introduce our methodology in the context of one of Trakx’s indices, the TOP 10 DEFI Index with the following composition:
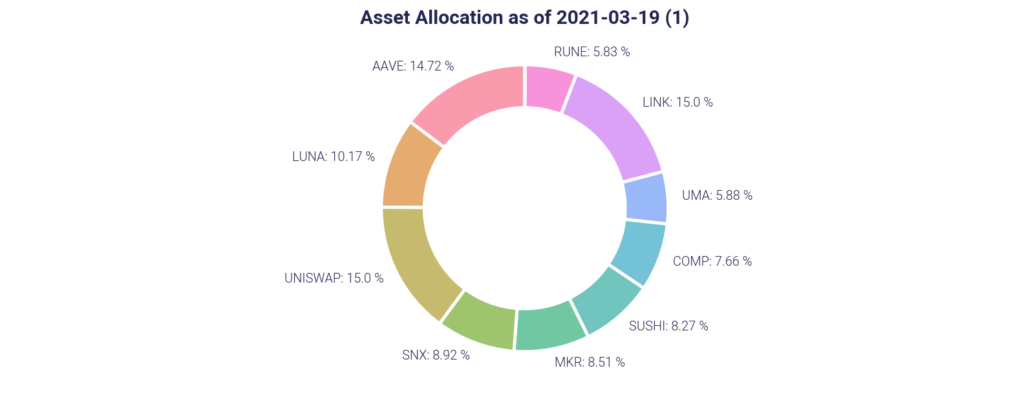
Our intention was to establish the fundamental liquidity profile of the index, enabling investors to tailor their execution strategy to the reality of the marketplace.
What are the fundamental characteristics an investor will want to know?
If you were to invest in any kind of security your first question would be to assess how much capacity is available without causing adverse price movements. Is that capacity compatible with your allocation? If not, you will not be able to build the exposure you want.
Investing in an index means buying the underlying basket and tracking changes through time. Those changes are governed by written documentation issued by the index sponsor. For example, if you were to invest $100,000 in an index with 4 equally weighted components, you would have to invest $25,000 in each of them. Each component has its own characteristics. Buying $25,000 in one of them may require digging significantly into the order book, while buying another may simply require hitting the first offer on the market. Furthermore, an optimized execution strategy needs to factor in the ability of an intermediary, for example, a specialized broker, to provide better prices than might otherwise be available. This would be the case for instance if the broker was able to find an aggressive seller when you placed your order.
We submit that there are really two principal measures of liquidity to help investors with their allocation on a given asset (or indeed index): capacity and slippage.
The notion of capacity answers the following question: how much volume is needed to absorb the exposure that I want to take (or unwind)? The same question can also be formulated differently: under reasonable constraints on my participation in the market, what is the addressable liquidity?
Slippage analysis is focused on the measure of price deterioration vs. execution size and is trying to answer the following question: what is the price deterioration associated with the exposure I want (i.e. how much do I have to pay to find adequate liquidity for my exposure)?
Capacity
Our liquidity analysis for Traxk Top 10 DEFI index looks at those measures (and several more incidentally). For example, the following chart shows the capacity for a 20% participation at a point in time (here daily for the second half of March):
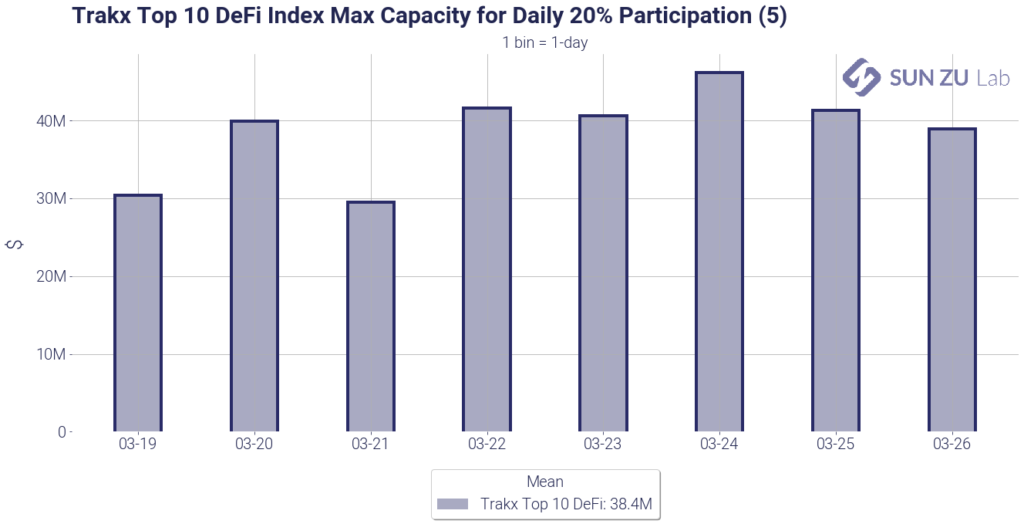
For each asset, the maximum addressable size is calculated under a constraint of 20% participation in the market. From this figure, a total capacity for the index is inferred based on individual asset weights. For instance, the figure of $40M on March 23rd reads as follows: buying $40M of the index on that day is the maximum to execute less than 20% of the day’s volume on each index component. As can be seen from the chart, the figure is fairly constant throughout the period, and the average is displayed in the legend: $38.4M.
Naturally looking at daily volumes may be inadequate for smaller exposures, and intraday figures would be useful. We do provide those as well, in the form of an hourly capacity:
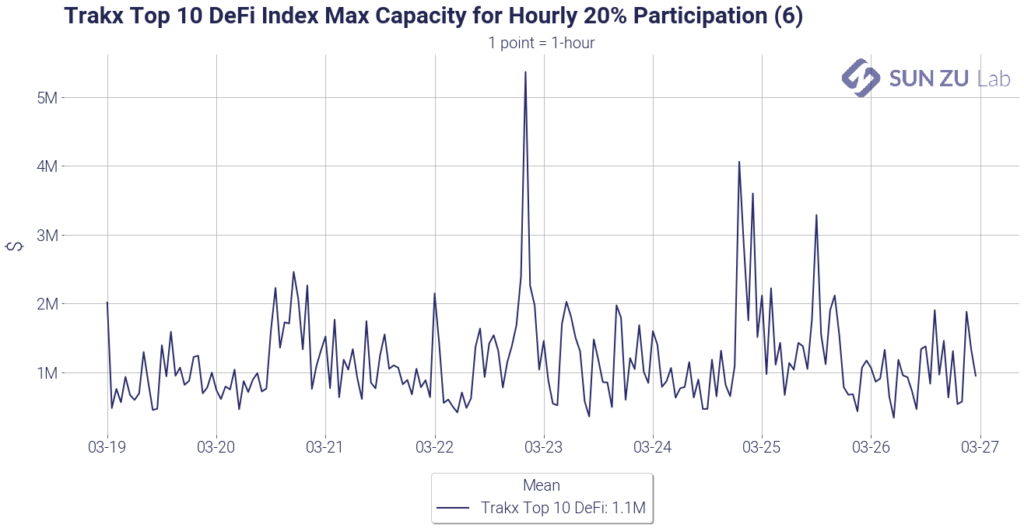
The calculation is identical to the daily one, except the time interval is set to 1 hour. The chart suggests that in this timeframe, a 20% cap in participation will result in a $1M addressable liquidity. This figure may seem small, but it shouldn’t be interpreted for more than what it is: a passive observation of market behavior. If a market participant was actually entering the market at one point to build his exposure, he would most certainly attract more liquidity above and beyond the one passively recorded here.
To complete the participation picture, we thought it would be useful to know which one of the index components is responsible for constraining the overall liquidity. If all components had similar liquidity at all times, this question wouldn’t be relevant, but naturally, this is not the case. Individual variations mean that one asset may be the “limiting factor” at one point in time but not before or later. To provide an intelligible picture we built the following chart:
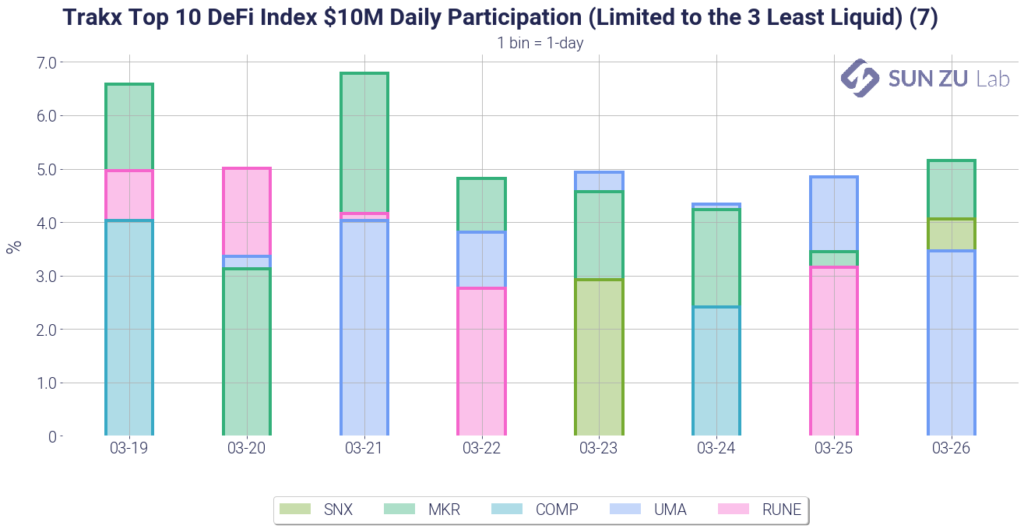
It shows over the considered timeframe the individual participations for the least liquid index components, for a $10M size. We limited the number of assets to 3 daily to avoid information overload. For example, on March 21st, a $10M order would have resulted in a 7% participation for MKR, 4% for RUNE, and 4% also for UMA. All other tokens had lower participation on that day (and hence are not shown here).
The picture gives the following insights:
- There is no single “limiting factor”: among the 10 tokens in the index, 5 of them appear in the least 3 liquid at one point or another. That is good news, it indicates that there is no “single point of failure” to transact the index.
- There are however tokens that appear more often: MKR and UMA are present almost every day. Particular attention should be dedicated to those two names when it comes to execution strategies.
- For index sponsorship at Trakx, those statistics may indicate the need for rebalancing the index if MKR or UMA (or any other token) exhibits insufficient liquidity. Along the same lines, investors may want to search the market for liquidity in MKR and UMA as a prerequisite to investing in the index.
Slippage
The other quantitative measure of liquidity is slippage. It is a measure of price deterioration when actively buying or selling a financial instrument. The idea is quite simple: if the mid-price of an asset is $100 when you start buying, and if your average price is $100.3, then slippage for this particular execution is 0.3%.
Slippage is a very “local” measure, it is extremely dependent on the execution strategy deployed, and on the circumstances of the moment. The same order may face very different conditions depending on when and where it is executed. Do you access liquidity on one single venue, on several, and if so which ones? Do you aggressively consume liquidity available in the order book or patiently place your orders and wait for matching orders?
To address those questions, we present the following chart, showing an intraday $500K market impact for the index:
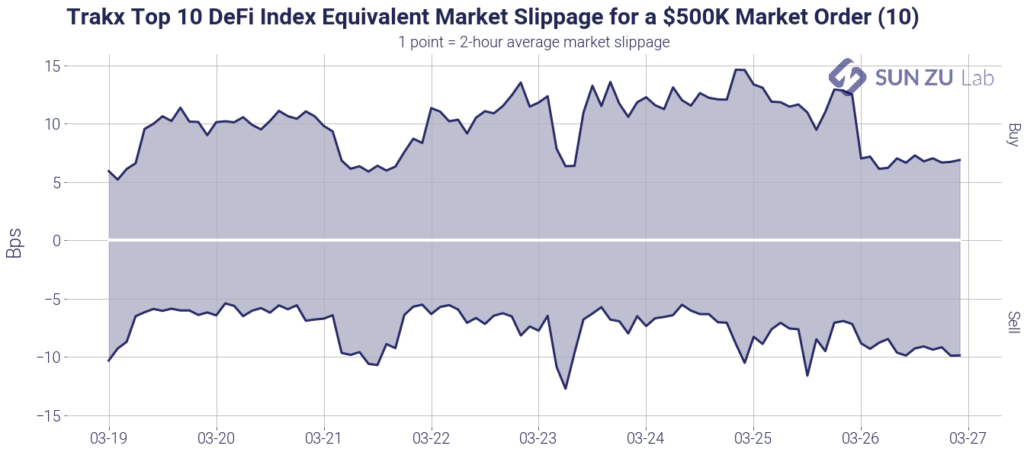
It shows the expected price deterioration for a $500K order over a 2-hour execution window, on both sides of the order book. As can be seen, the impact here is quite reasonable at around 10 bps. As was said before, this figure shouldn’t be taken for more than what it is: if an investor was to enter the market, there is no way of telling how much more liquidity he would find. Along the same lines, for an order larger than $500K, the estimated impact cannot be considered linear (i.e. $1M order would not necessarily create a 20 bps impact).
Like before we wonder also about the intraday “limiting factor”: which token(s) is(are) responsible for this impact? We answer this question along two distinct axes. First, we look at the 3 tokens with the largest capitalization in the index to get a sense of slippage on them. Second, we look at the 3 least liquid. The following charts show the results:
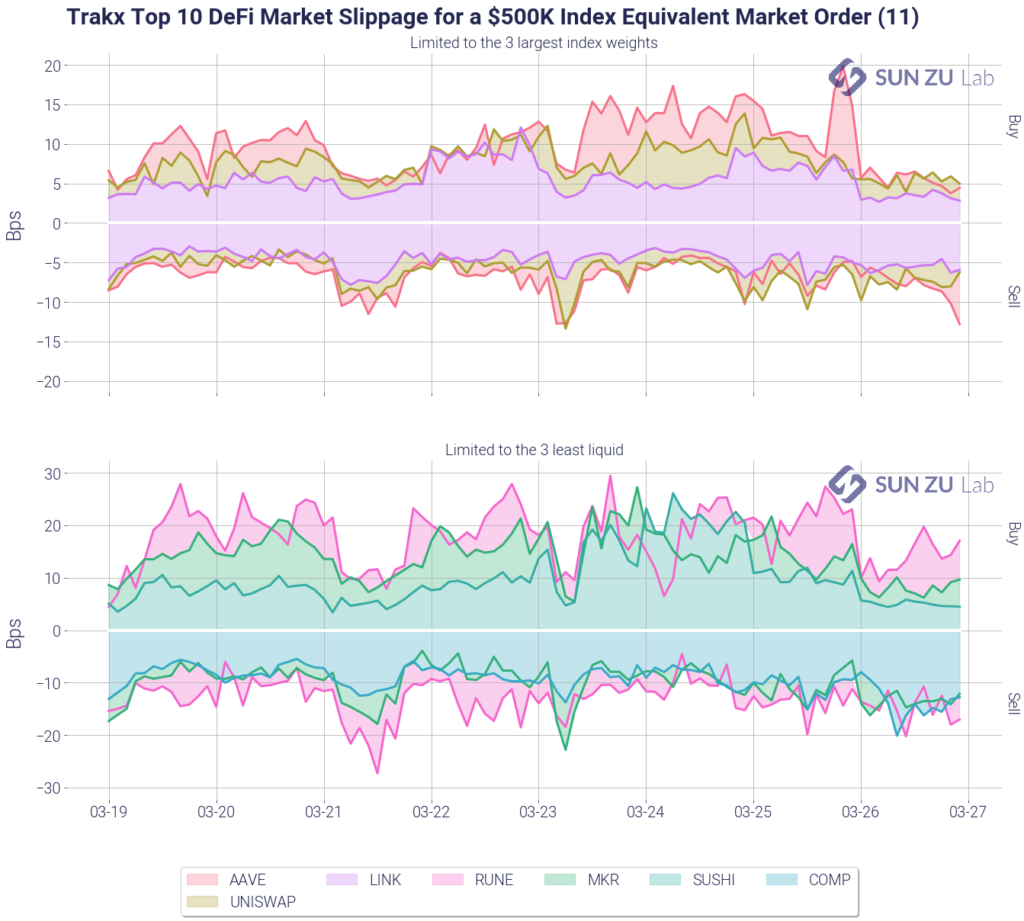
The largest cap tokens are indeed not limiting factors here, if anything the impact on those (5~10 bps) is smaller than on the index as a whole. The 3 least liquid are indeed responsible for the impact of the index, at 10~20bps each.
Note by the way that the least liquid according to the impact metric (RUNE, MKR, COMP) are similar to those considered least liquid when looking at trading volume (RUNE, MKR, COMP).
Conclusion
What actionable conclusion is an investor to draw from this analysis? Well, firstly he or she would be able to quantify the current addressable exposure in the marketplace. This is quite important information, as it enables sizing up execution. Secondly, he or she can extract a first-order estimate of market impact for the considered index. This is also a critical factor, if only because it is helpful when benchmarking providers of execution services, whatever the form (algo, block, direct-market access, etc.) Finally, we believe our research can help Trakx refine its indexing methodology, to reflect not only capitalization but also liquidity, another key characteristic to promote truly investable indices.
Because digital assets are still in their infancy, those metrics should be monitored closely as they evolve almost daily. To enable investors to keep close contact with the market, SUN ZU produces an impact analysis at least twice monthly, and on-demand if necessary.
Tether as a Central Bank
Central banks routinely issue money without any reserve backing it. Could Tether do the same and become the first decentralized central bank?
I have expressed before skepticism about Tether (a.k.a USDT) and the fact that a high level of uncertainty still exists on the actual level of reserves backing the token issuance. For all the bad press this uncertainty has created however, a similar situation has occurred regularly in history. Before central banks became the norm, many commercial banks and governments took liberties in issuing money, if only to finance recurring war efforts here and there. In fact couldn’t the same be said of central banks today after the financial crisis of 2008 and the COVID economic disaster of early 2020?
At the end of WWII, to avoid a repeat of past monetary crises and install stable foundations for reconstruction and international commerce, governments of developed economies formed and adhered to a new monetary pact, the Bretton-Woods system.

The idea was simple: fix exchange rates between the most important currencies, and back every dollar in circulation with a measurable and controllable inventory of physical asset, and you immediately choke inflationary pressures. Furthermore you prevent political agendas to interfere with monetary policy (in the form of trade wars for example).
The asset chosen for Bretton-Woods was gold, a natural choice at the time. With significant yet slow-growing supply, gold was already a commodity actively traded, and for which trade and storage were already well organized. The final element in the equation was convertibility: anybody in possession of gold could obtain dollars (or any other currency) and vice-versa, at a fixed exchange rate. In reality only governments and central banks were able to convert, a restriction which de factor created two distinct marketplaces for gold: one for central bankers, one for private participants. Convertibility was not an easy feat: it took more than 10 years to fully deploy because of its impact on each participant’s ablitity to control its flow of capital on international markets. Western European economies enforced convertibility in 1958, only when they were strong enough to accomodate free-floating capital flows.
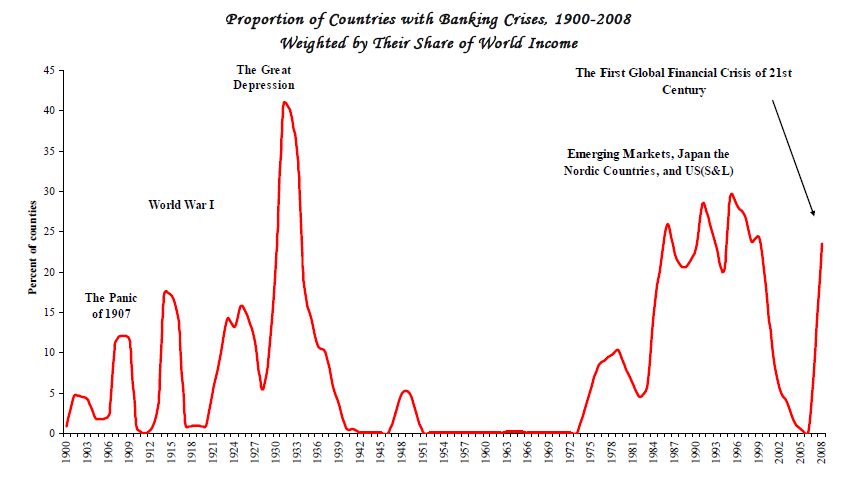
The result was quite remarkable, a period of previously unknown financial stability which in turn paved the way for massive economic growth. For 30 years, the world enjoyed exceptional growth and a quasi-absence of financial crises:
Imbalances were quick to appear though, for reasons intuitively simple: the dollar effectively became the currency of reference and was in high demand. That demand was not fulfilled by a rise in gold supply. The gap between the two created an arbitrage between prices for central bank gold vs. private markets and an unsustainable drain on the US gold reserves:
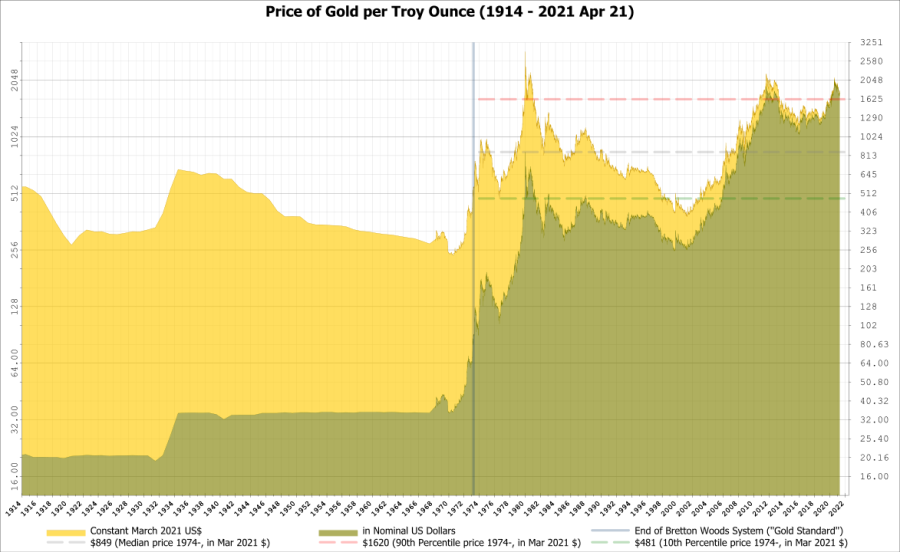
In 1971 Nixon unilateraly suspended the gold/dollar convertibility and a system of floating exchange rates progressively imposed itself.
Now what does it all have to do with Tether? Well, Tether is effectively used as a settlement currency for bitcoin transactions. Many crypto exchanges do not even list BTC pairs against fiat money. The rise of bitcoin to $60,000 was accompanied by a massive issuance of Tether (and other stable coins incidentally). [NB: there are two reasons for this: one is technical (it is far easier to settle a BTC/USDT transaction than a BTC/USD one), the other reglementary: USDT being totally unregulated, anybody can conduct business using it, whereas conducting business in USD immediately puts you in the perimeter of US regulators].
In the crypto eco-system, Tether is the equivalent of the US dollar in the financial system at the end of WWII: it is the currency that flows throughout the system and enables participants to trade when and where they want. The actual US dollar is the equivalent of gold in Bretton Woods: the undisputed store of value, from which all other currency units draw their value. We have a fixed exchange rate (1 tether = 1 USD) and convertibility at will: look no further, this is a mini-Bretton Woods.
What if Tether announced tomorrow that they don’t want to enforce convertibility anymore, and oh by the way, “we don’t really have a 1-to-1 reserve pool”? The company could keep issuing USDT as it sees fit, feeding the marketplace with enough liquidity to “keep it going”. If indeed all USDT holders consider they have good reasons to hold Tether, because it helps them trade, there’s is really no reason for them to dispose of it. A “Nixon shock” whereby Tether would announce it will not enforce the 1-to-1 parity anymore could be followed by a new rule of floating exchange rate. Would there be a fundamental problem with that? Abolutely not. When Nixon announced the US would not enforce parity anymore it was a unilateral decision, and there’s no doubt there were immediate winners and losers. It was a shock, economically and politically, yet it was not the end of world. The resulting role of Tether would be that of a de-facto all-powerful central bank, controling the reference currency of the crypto eco-system. Quite an enviable position if you ask me.
So why don’t they? As interesting as it sounds, this idea raises a few issues:
- a floating exchange rate means that some people will have lost a lot of money. Contrary to Bretton Woods populated by Secretaries of State and Central Bankers, Tether is a private company and unpegging its USDT from the dollar would amount to nothing less than a fraud if the company was not in a position to repay USDT holders according to the original promise. Now of course, how is that original promise contractualized? What is its legal strength, what could an individual do in front of such a situation? This is difficult to say with certainty, it depends (surprise surprise) on the specifics of Tether situation and on the wording of the (legally binding?) documents behind its token.
- Bretton-Woods was a matter of international public policy, Tether is an unregulated private agent. How trustworthy is it? If it changed the rules once, could it do it again?
- Central banks are extraordinarily transparent. Their charter dictates what they can and cannot do, their operations are usually referred to as “open market” because they are indeed performed in plain sight on open markets. Rules are disclosed, available to all and applicable to all. Their balance sheet is also pubicly available (even though it is after the fact, but it is difficult to operate otherwise). The standard of transparency is so high because of the power they hold over the economy. Would Tether, entrusted with such power, be willing to hold itself to such a standard? Track record so far is not great to say the least.
- In the end, the Federal Reserve is chartered by its national government (the same is true of all central banks). I honestly don’t know if the notion of “public good” is explicit in its charter, but certainly enforcing monetary stability and acting as a lender of last resort both serve public interest. The role of central banks in 2008 and post-COVID is an undeniable testimony to that. Would Tether be willing to commit itself to the promotion of a greater good — as opposed to the promotion of personal interests, whatever those might be? How would we convince ourselves once and for all that it is indeed the case?
- The Federal Reserve draws its legitimacy from the confidence the general pbulic puts in the rule of law and military power of the US (the same goes for the US dollar). Where would Tether draw its legitimacy from? Not quite an easy answer there.
A central bank is the ultimate government-sponsored trusted third party. The crypto eco-system was born in part on the rejection of the “government-sponsored” part, on the idea that it would be possible to build an “algorithmic” trusted third party bypassing the existing financial system and devoid of interference from governments. Can Tether rise to the challenge?
Arbitrage on digital assets
How we built a quantitative indicator on market integration
There is a lot of talk about arbitrage in the world of digital assets. Myth or reality?
We at SUN ZU Lab wanted to provide the necessary tools to examine this question and provide reliable answers. Therefore we designed a quantitative indicator to detect macro arbitrage opportunities when markets fall out of synchronization. Our goal was to produce an indicator that captures the existence and broad magnitude of price discrepancies between markets on the same asset. A secondary objective was to determine to what extend those discrepancies appear and disappear based on market behavior (e.g. volatility) or geography (e.g. region).
To that effect, we built our indicator which we denote “arbitrage index” (AI) calculated as follows. Let amp(1’, t) be the 1-minute volume-weighted average price (VWAP) amplitude:
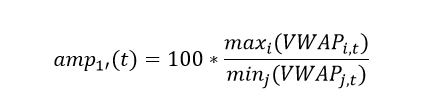
i and j are indices on markets. VWAP is the volume-weighted average price on a given market at time t. In plain English, amp(1’,t) is the ratio of the highest VWAP to the lowest VWAP across all included exchanges for a given 1’ interval. The arbitrage index (AI) is the hourly average of all amp(1’,t).
This indicator fulfills our need:
- In the absence of price discrepancies between two markets, their respective VWAP over a given period of time are very close if not equal. In the above formulation, this translates into: amp(1’) = 1 at any point in time. This idea can be easily generalized: adding more markets trading at the same price will keep amp(1’) close to 1.
- By construction amp(1’) > 1, and so is the index AI. A deviation in price will result in a deviation of AI from 1.
- Because AI is an average over period of 1 hour, short-lived deviations tend to be averaged out. For AI to differ significantly from 1, there needs to be significant variations for short periods, or smaller variations that last. The indicator is not meant to distinguish between the two situations, but it clearly shows when prices are not aligned.
- The index is only dependent on trade data, not order book data. This is helpful because order book data (also called level III) is quite difficult to obtain. Many exchanges offer periodic “snapshots” but intractable issues potentially arise when processing those snapshots, first and foremost the fact that they are not synchronized.
- Comparing market integration across space is relatively simple: markets are grouped by region, and by construction, all min/max ratios are limited to intra-group comparison.
Market professionals will find that this indicator is too “macro” and not precise enough. Indeed, it is true that this methodology leads to only a gross estimation of real-life price discrepancies. A rigorous analysis based on tick-by-tick analysis would yield much more robust estimates, as they are seen in real time by active traders (by the way we do agree and will move in that direction!). Nevertheless our indicator does a fair job at showing relative market integration, both in space and in time, which is exactly its objective.
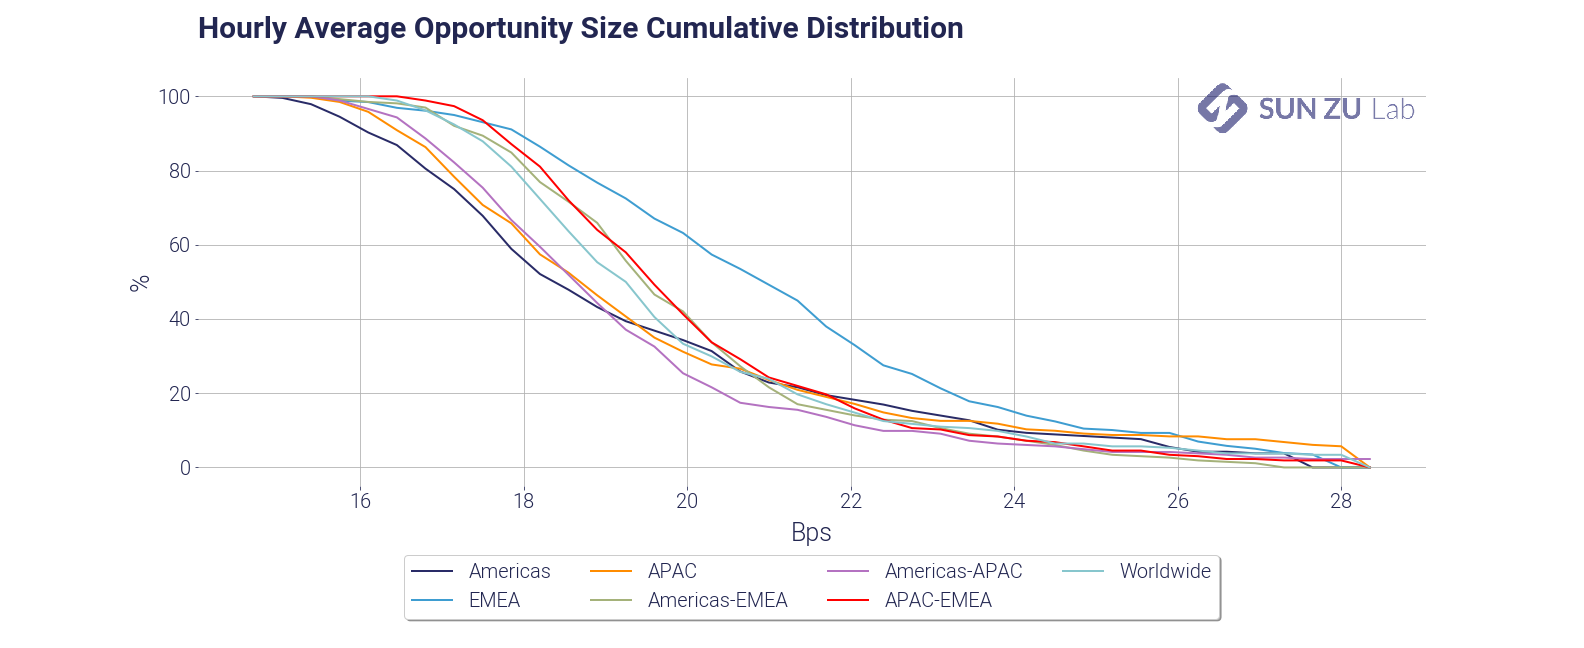
For the purpose of practical calculations, markets have been grouped in three regions:

The chart below presents the index globally (top), by region (bottom left), and inter-region (bottom right):

It appears the index differs significantly from 1 during the period, which clearly shows that market are far from being closely integrated.
The following charts show volatility, and the cross-reference between the index and volatility:
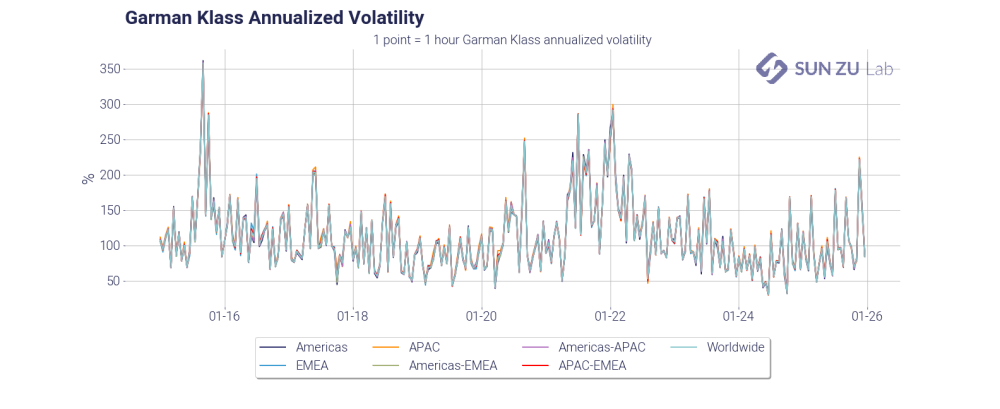
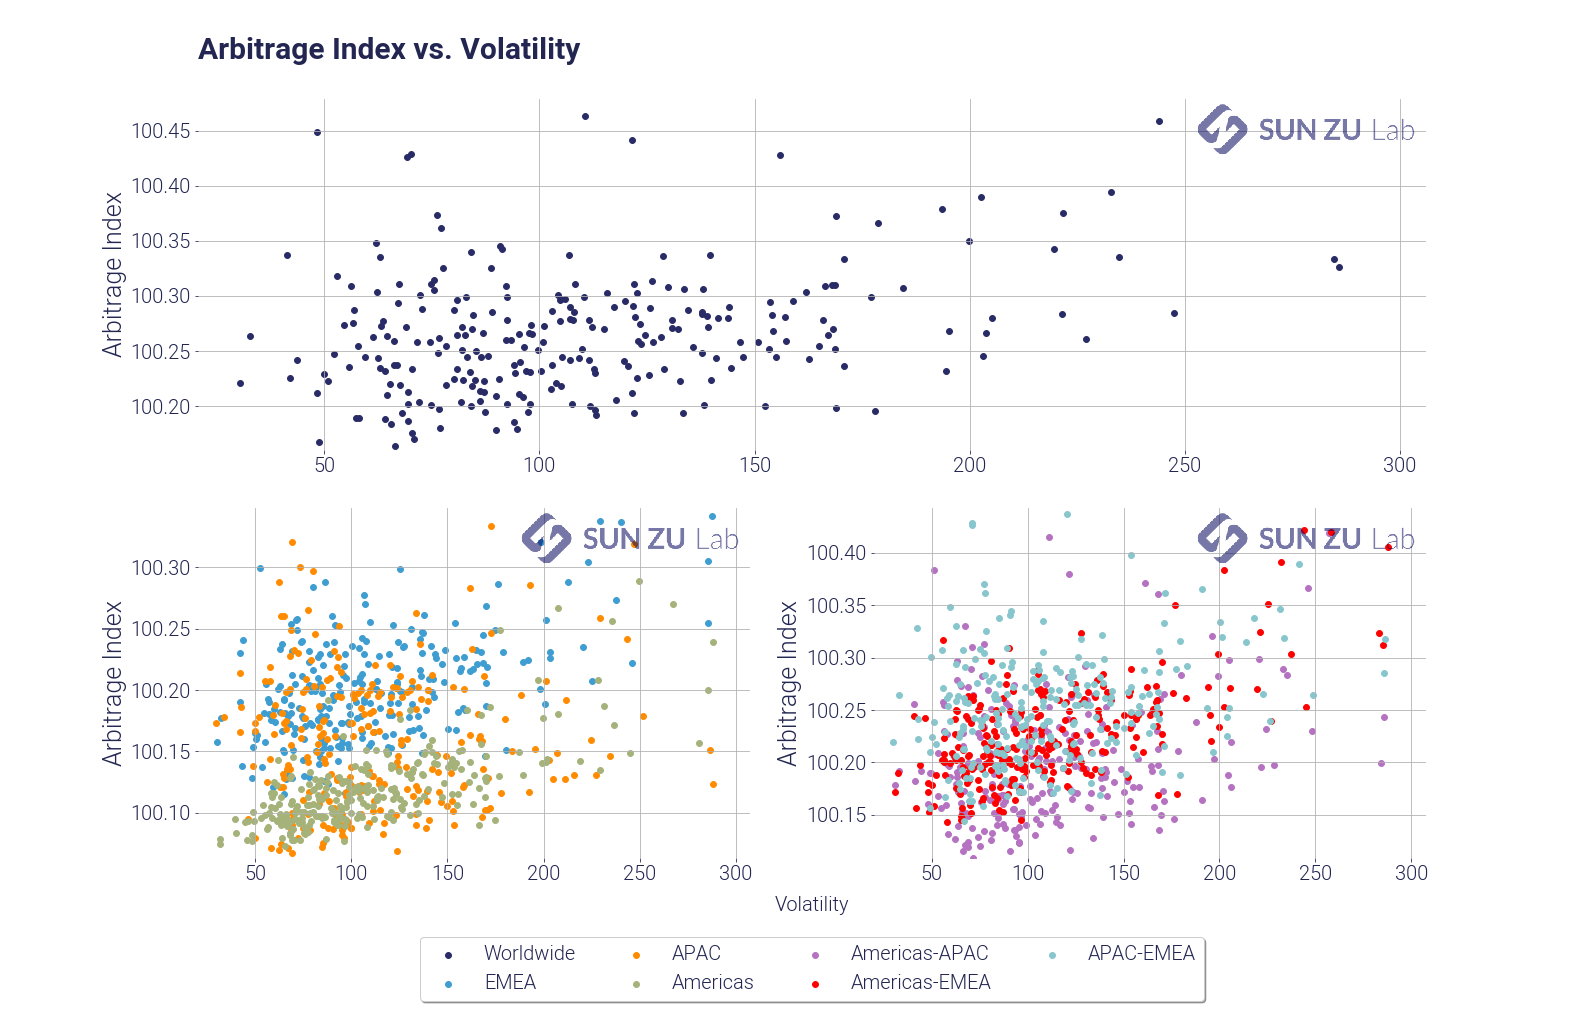
Even though the relationship between the two doesn’t appear to be straightforward, there is a strong sense that the indicator does indeed increase for volatile prices. At the same time it is fair to conclude that volatility is not the only factor responsible for prices being out of sync.
We go one step further in our analysis and produce a “theoretical P&L” based on opportunities we detect. What is an opportunity? As it happens crypto exchanges produce a useful indicator for each trade: the side of the trade (bid or ask). Based on this indicator it becomes possible to isolate price discrepancies that could be seen as an arbitrage opportunity by participants. Here is our methodology:
- for each incoming trade, we know the price, quantity, side and timestamp. We look back at each transaction that preceded across all exchanges in the same region, within a 500 ms window. This last parameter has been fixed arbitrarily, but is meant to capture the “typical” time window needed for traders to identify and capture opportunities. Our liquidity report shows for example the mean time between trades for different exchanges, and it is typically between 500ms and 2s. For a trader to lock an arbitrage there would have to be at least two orders sent at the same time, immediately after the price anomaly is detected. We hypothesize that the latency to post those, combined with the latency for detection, is at most 500 ms. In some cases a market maker may already be present in the order book on one side, in which case there would only be a single order to send. We are very mindful of our choice for the time window, and further research may lead us to refine our model.
- If we find in the previous 500 ms window a trade with an opposite side and better price, we consider an opportunity appeared. For example with a transaction of 1 BTC at $10,000 (a very hypothetical price these days) registered on the offer of one exchange, we scan the preceding 500 ms for transactions on the bid, at a price higher than $10,000. The existence, within this time frame, of those two transactions suggest that at some point the bid of one exchange was strictly above the ask of another, thereby creating an opportunity that would have been seen by all and possibly captured.
- When two transactions are paired, we consider the minimum size of the two to be consummated and not available for subsequent pairing. This way we make sure that volume for each transaction cannot be included in two distinct opportunities. We then increment several counters: the number of opportunities, the theoretical P&L, and the arbitrable quantity.
- We also filter out all opportunities below a minimum threshold (15 bps in the charts below) to keep the noise level under control, and accounts for wide differences in execution circomstances. For example a market maker physically located near an exchange will probably enjoy fairly low trading costs and latency. It is naturally impossible to account for the variety of situations, therefore excluding small to very small discrepancies is a “brute force” fix. This trimming significantly decreases the number of anomalies detected.
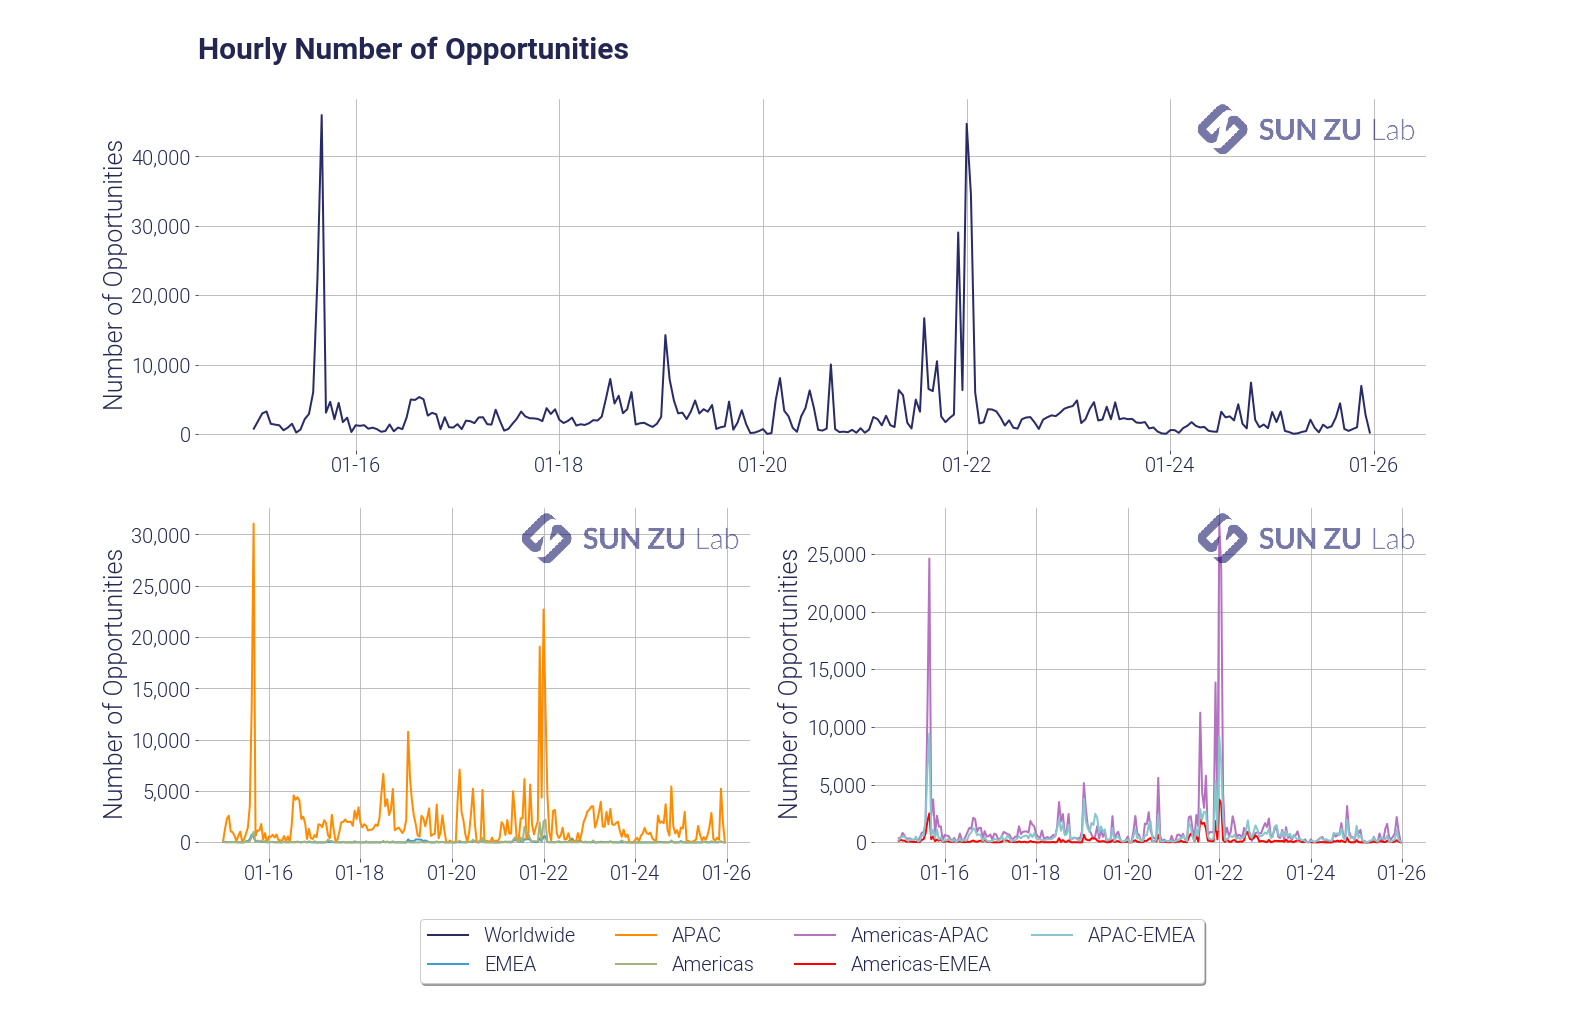
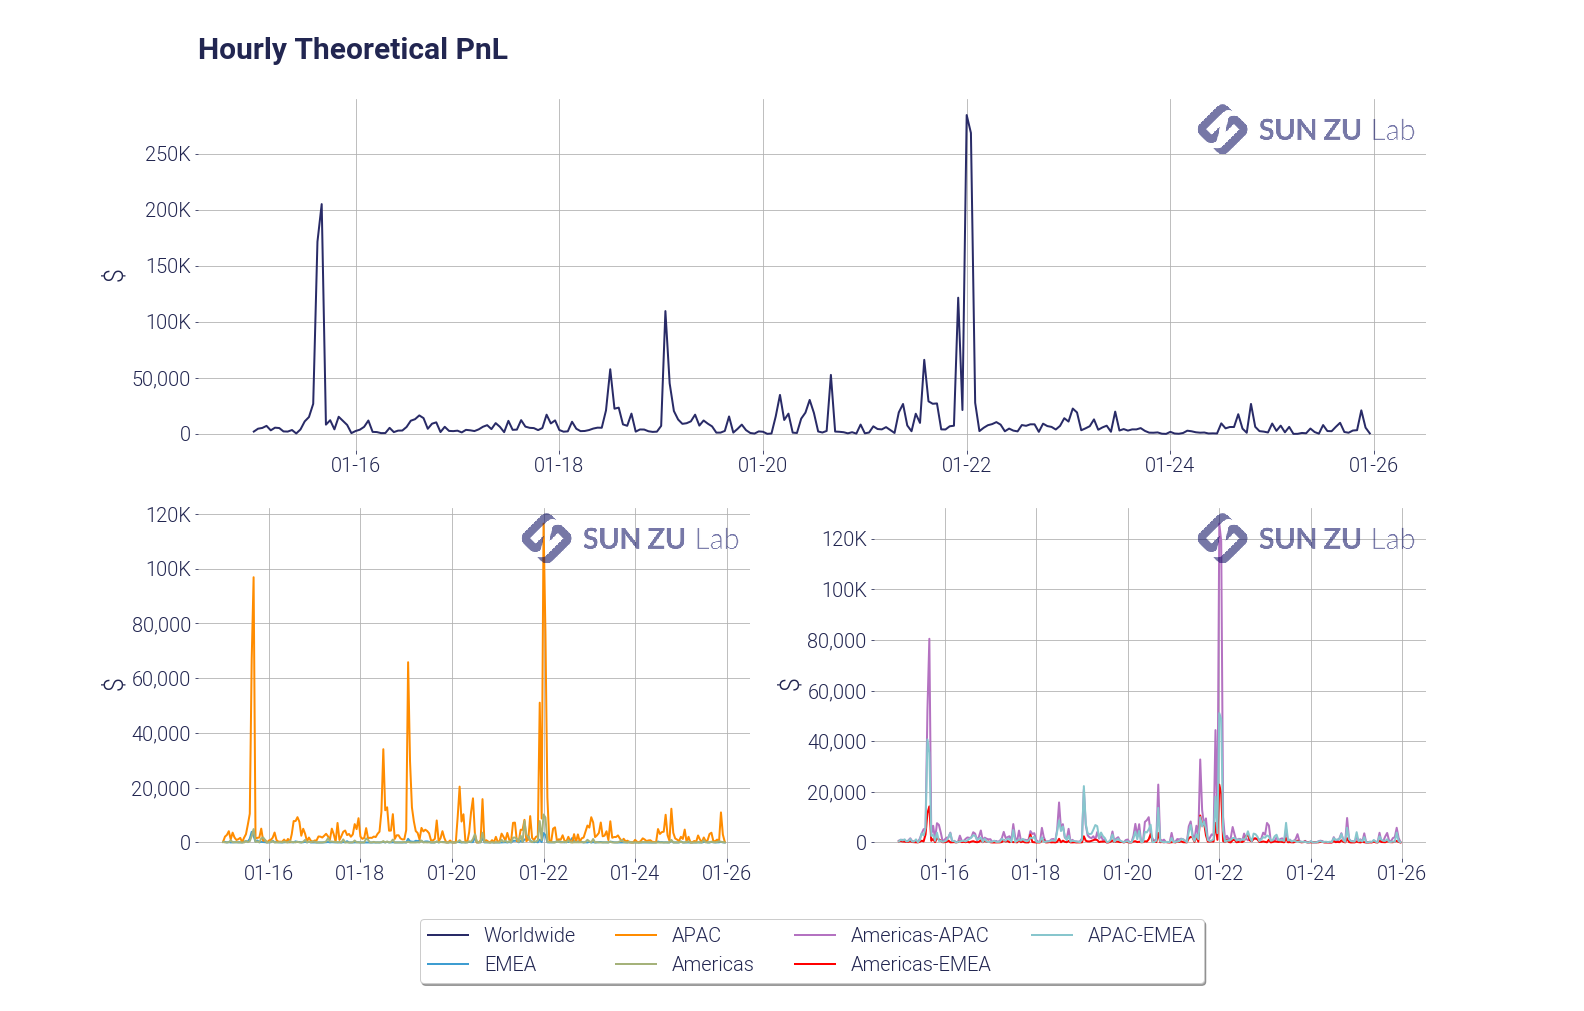
This methodology leads to the following results:
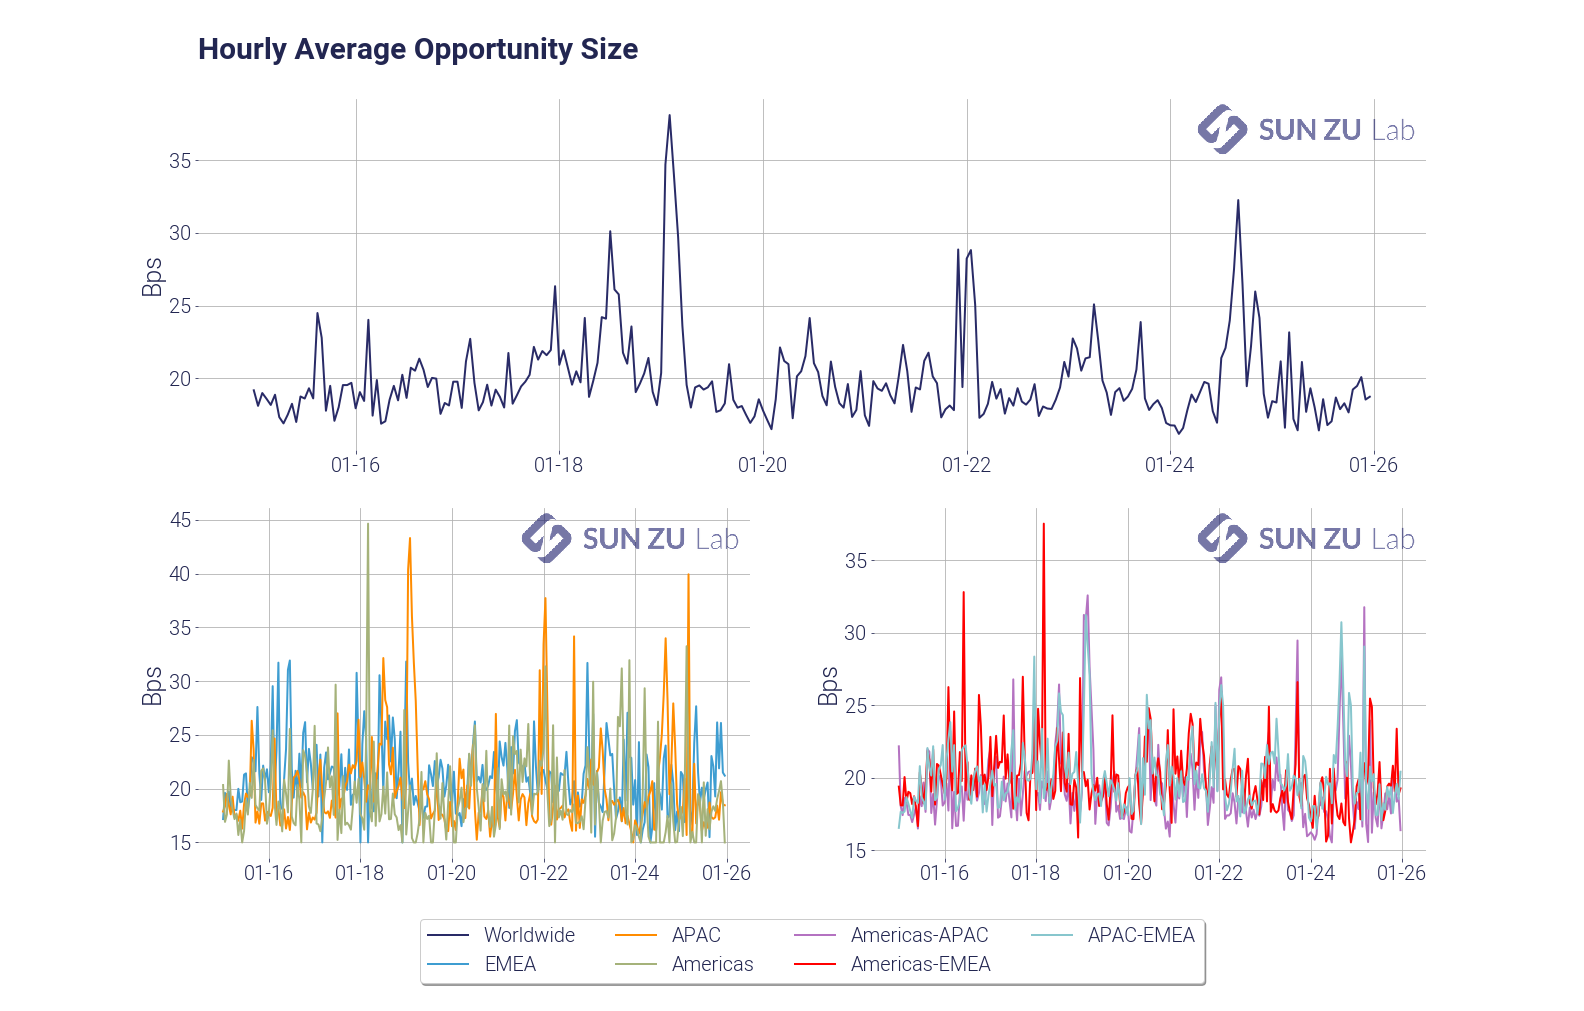
And subsequently to the following theoretical P&L:
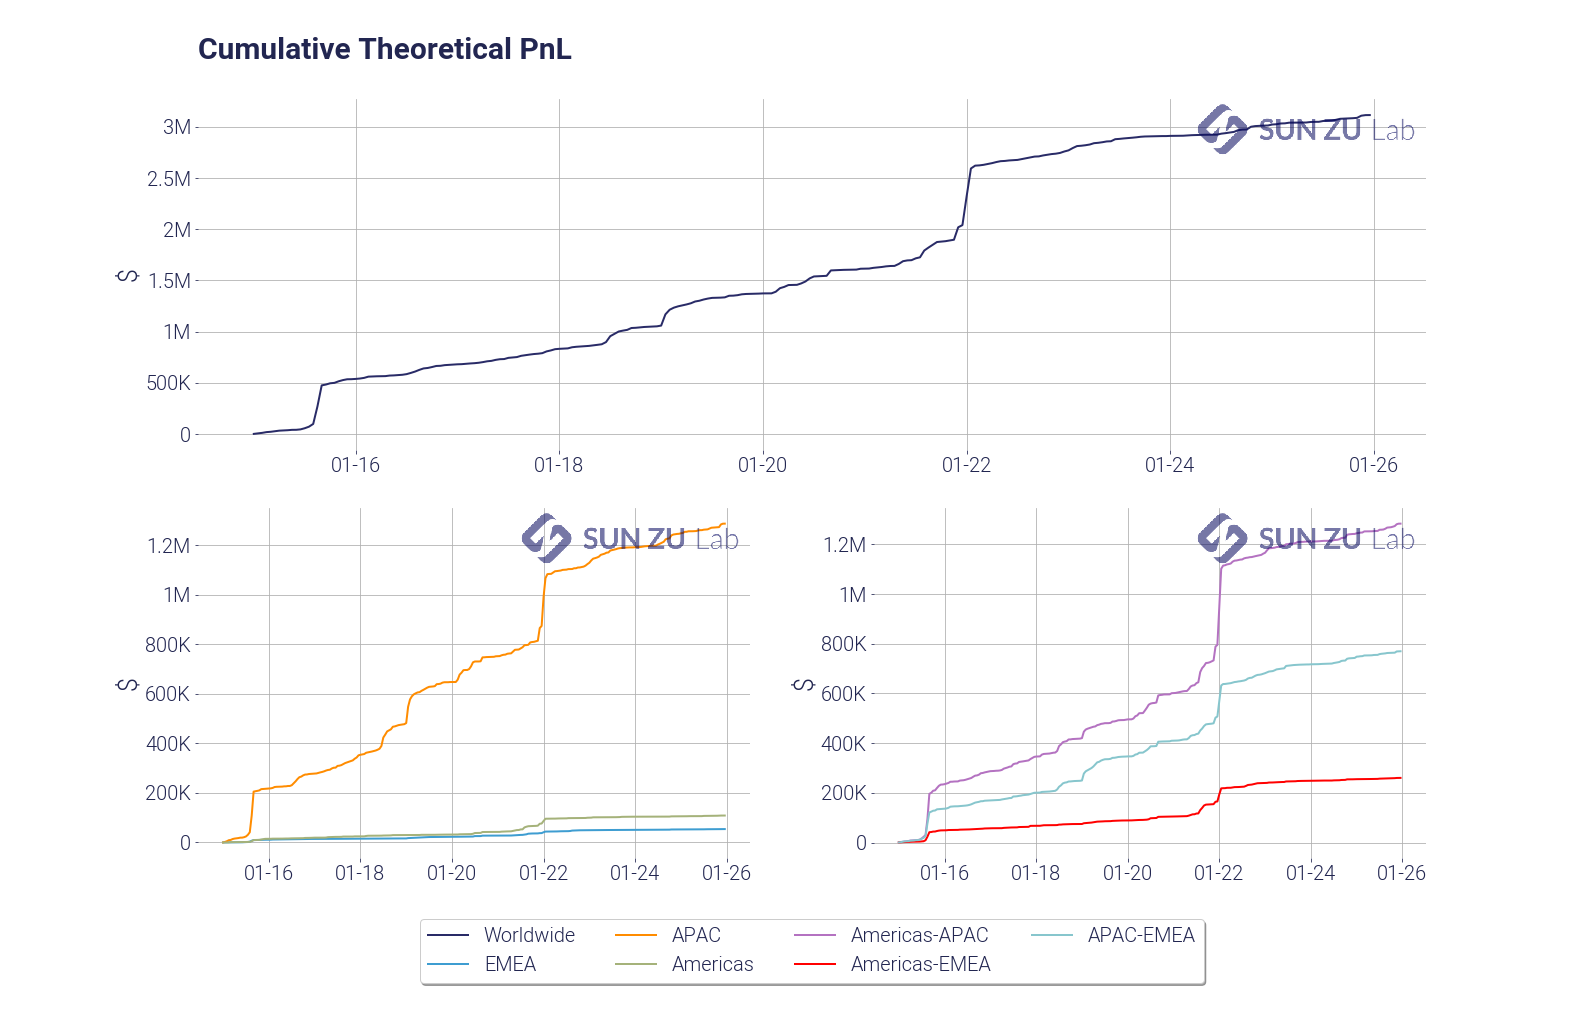
Overall, we believe our AI indicator is a reliable and significant measure of market integration, and we will produce a bi-monthly report incorporating the above results (and more!) for BTC as well as other digital assets. Investors seriously curious about cryptocurrencies and digital assets may find in this a way to monitor market efficiency as it evolves through time and across trading venues.
To register for a 30-day free trial on our research consult our web site or contact us. And by the way feedback and comments are always welcome!
Price discrepancies in the world of digital assets

What a strange market!
We at SUN ZU Lab are striving to gain a deep understanding of how the markets for digital assets function, to help our clients achieve their investment strategy through better execution. Based on our long (very long!) experience of traditional markets, we have started looking closely at liquidity and arbitrage. The interested reader will find a sample of our efforts here.
We subsequently turned our attention to the basic behavior of trading venues, trying to understand if there was something special there compared to what we knew of traditional well-established exchanges. Thus we started looking at small-scale data to try and detect unusual patterns. Because we aimed at being as systematic and unbiased as possible, we devised automated filters to isolate those events.
The result is our latest weekly “market anomalies” report, which presents events selected because of a sharp price movement or heavy volume. For each of those events, we look at price discrepancies and/or volume patterns. Well, the results are quite surprising, here are three examples abstracted from our report dated March 26th for bitcoin.
Price anomaly #1: -1.53% on 3/21/21 between 09:43 and 09:44 UTC
By looking at the most significant price movements over a 1-minute interval we can detect periods where markets are moving “fast”, and those moments are very good candidates to detect unusual price or volume patterns.
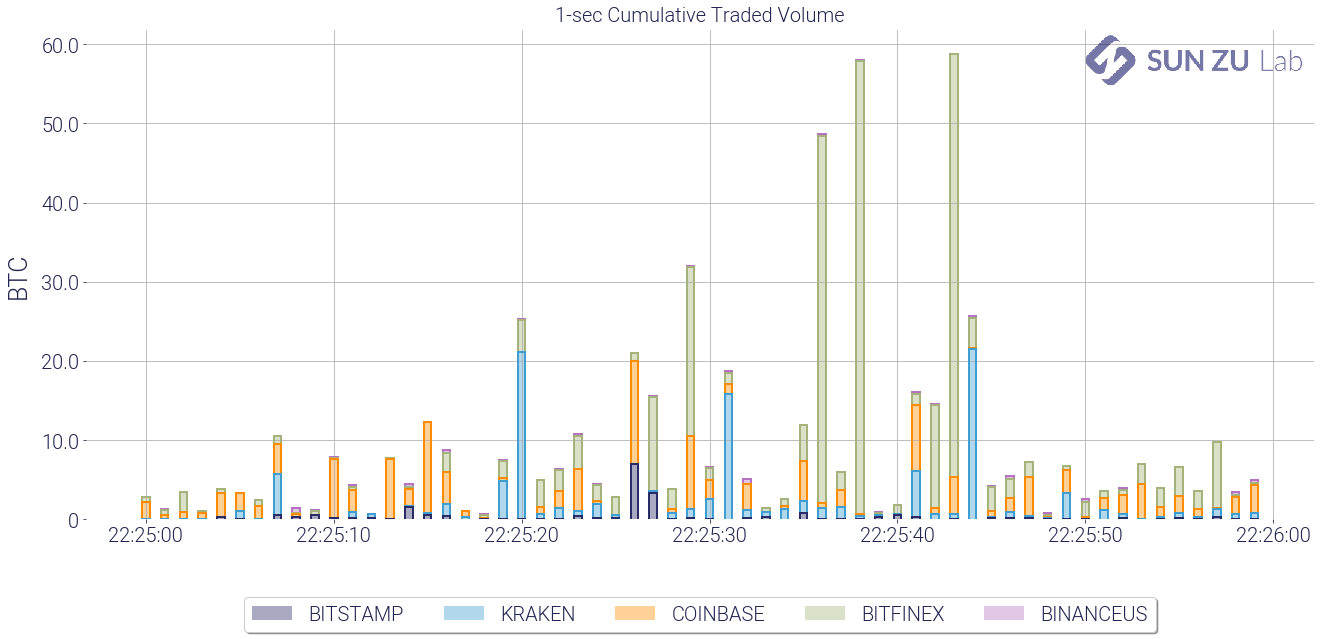
As an illustration, below is the 1-minute charts of BTC prices and volumes on 5 venues, between 9:43 and 9:44 on 3/21:


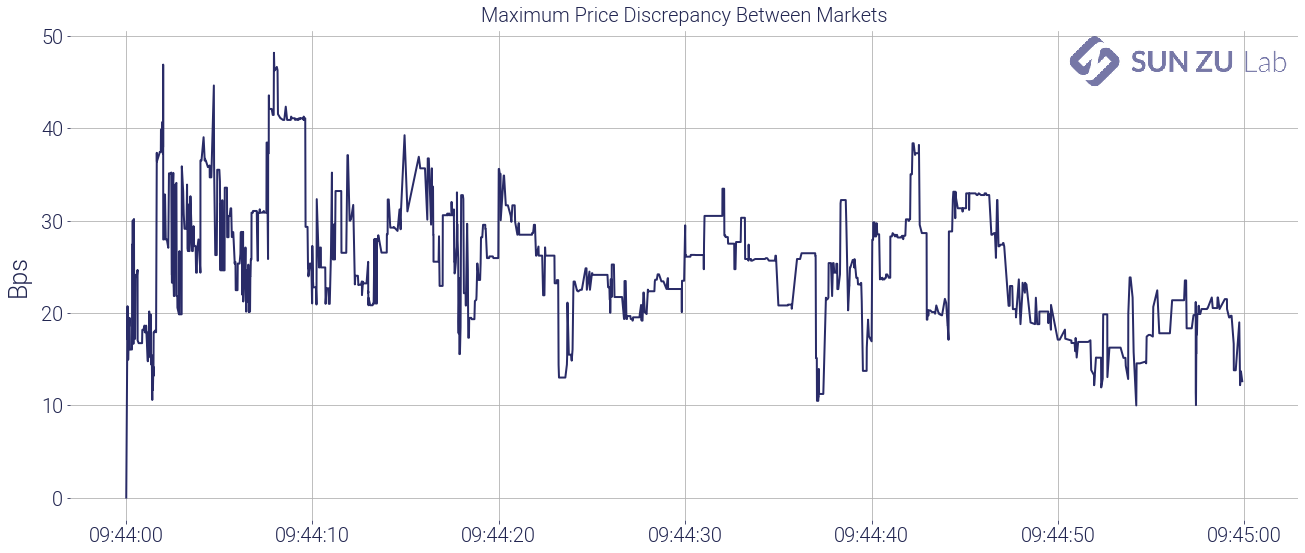
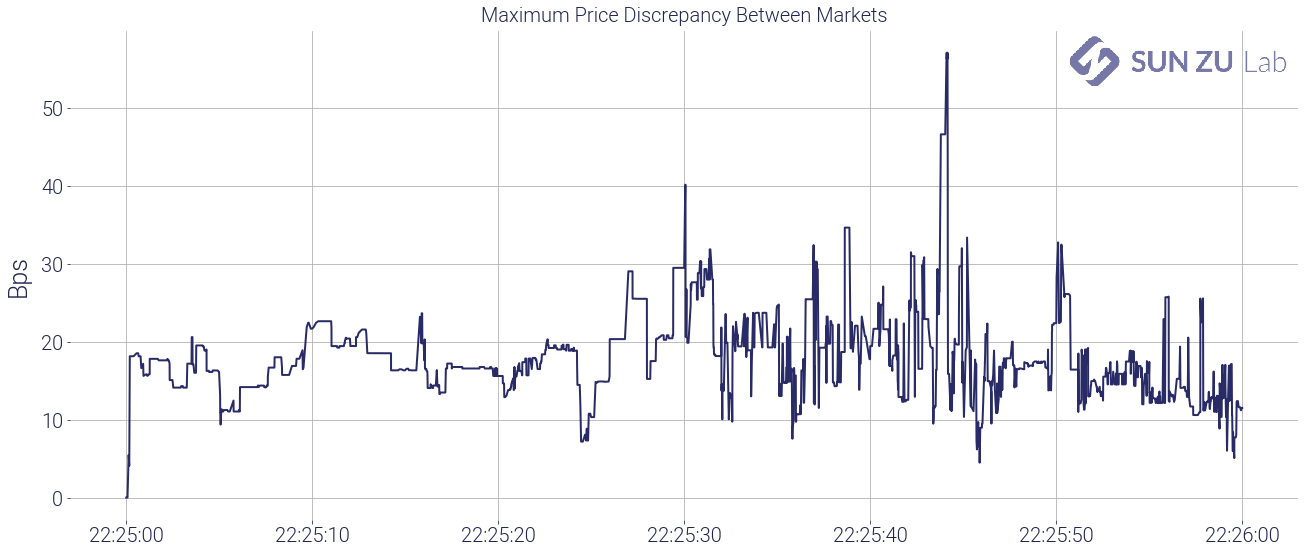
To get a better sense of price discrepancies, we chart the maximum price difference in the interval between the lower and higher price:
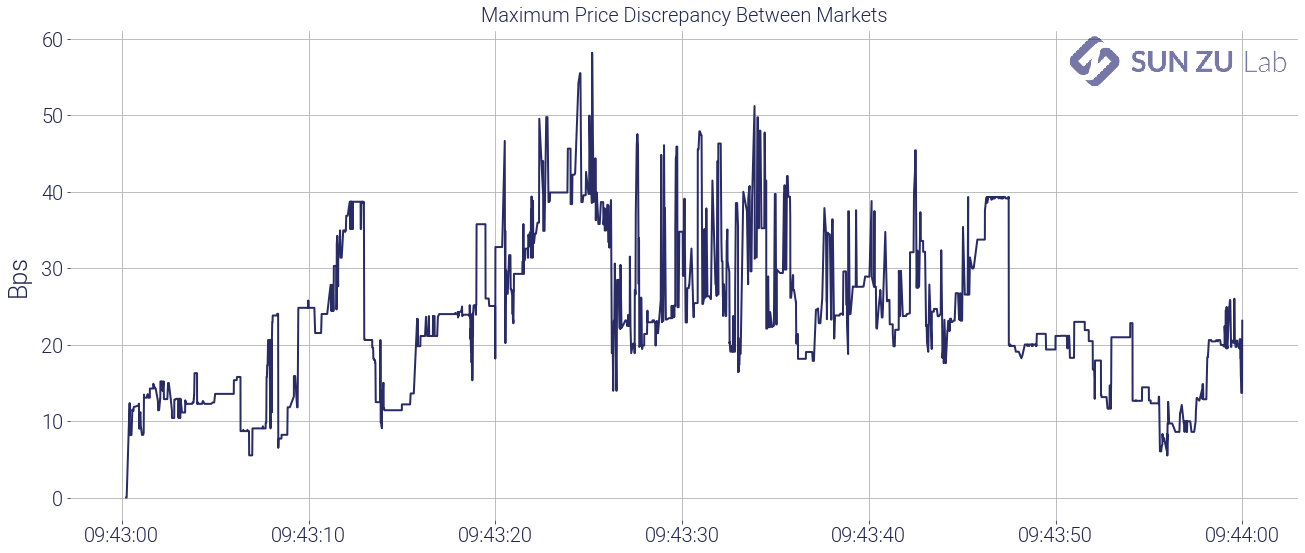
It is fairly clear that during this period, prices on the different venues were far from being “aligned”. In another of our reports, we look at price discrepancies and arbitrage opportunities at a macro scale, but here at the tick level, we suspect there are opportunities to be grabbed.
Or are there? Let’s have a closer look at the strangeness of this picture:
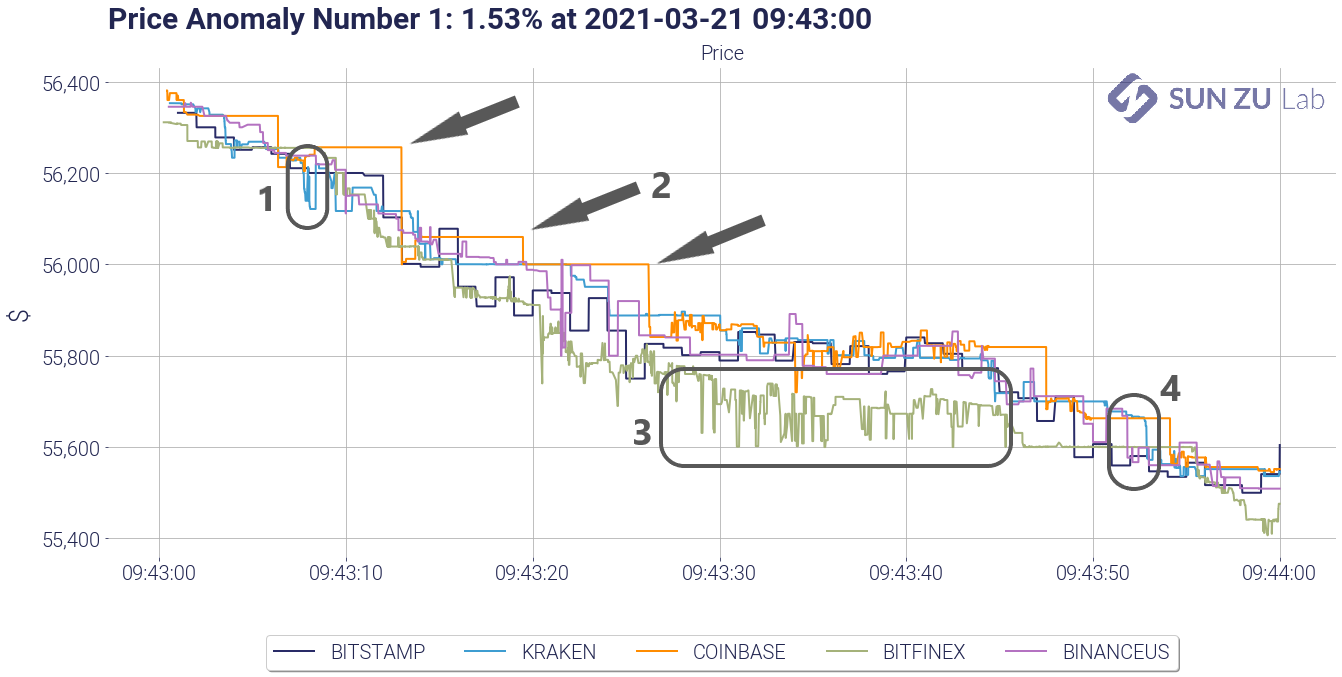
I have numbered 4 surprising patterns:
- a small blip of Kraken vs. other exchanges: what is happening on Kraken at that precise time? BTC is trading there several times $100 below other markets. What is unexpected is not the fact that one venue experiences sharp movements independently from the others. The surprising part is that none of the other venues moves in sync. We strongly suspect that there are many arbitragers out there sharpening their trading algorithms to specifically identify and exploit those situations. Why was there no change anywhere but on Kraken? One possible explanation is that there was not enough time to capture that opportunity. Well, this is unlikely because as it happens all venues traded repeatedly during a window that lasted several seconds. Another explanation is that bid/ask spreads were very wide and trades occurring on one side of the spread appeared to be out of sync. Investigating that idea requires tick-by-tick order book data, and a little bit of work (but do not worry we are on it). Another explanation could be that some of the trades on Kraken were fake trades, or that they happened outside the regular bid/ask spread if they were “pre-negotiated” (a particular status that indicates a block trade on traditional exchanges). In any case, we would need a little bit more information from the exchange to be able to conclude.
- Coinbase price seems to be lagging: as surprising as it looks, this type of pattern is quite straightforward to explain. It results from the lag in order book positioning on Coinbase. The bid/ask spreads on other exchanges adapts more rapidly, which means that prices tend to lag and adjust at the last moment (i.e. the next transaction) on Coinbase. Again confirming this initial intuition requires tick-by-tick order book data, but nothing worrying there.
- Bitfinex at $100 to $150 discount compared to other markets: well, that’s a big one. The discount on Bitfinex appears 20 seconds before but stays stubbornly high. It appears and doesn’t disappear for some time (see #2 anomaly below where it exists with the same magnitude). A discount like this would rarely appear on traditional markets (stocks, derivatives, bonds, etc) because market participants would arbitrage it away sooner rather than later. If it persists as it does here, it is not your typical liquidity discount. Indeed, it is associated with Bitfinex, other exchanges keep trading in sync (more or less). Therefore the underlying reason is to be found with the specifics of Bitfinex: are there trading constraints that would induce investors to severely discount BTC on that platform compared to another? Indeed our research confirms that this discount appears quite regularly, and never turns into a premium. Investors should therefore be mindful and investigate further the underlying reasons that could create a recurring anomaly like this (as will we!).
- $80 price difference between Kraken on one side and Bitstamp/Binance on the other: whereas Kraken was at the bottom before, it is now trading higher than the others. Coinbase is lagging, Bitfinex is still at a discount, but Bitstamp/Binance and Kraken repeatedly trade at a $100 difference for 6 to 7 seconds. Are those real arbitrage transactions or “visual effects” due to lagging or fake transactions? As before we need tick-by-tick order books to conclude, and possible further information from the exchanges if everything else proves insufficient.
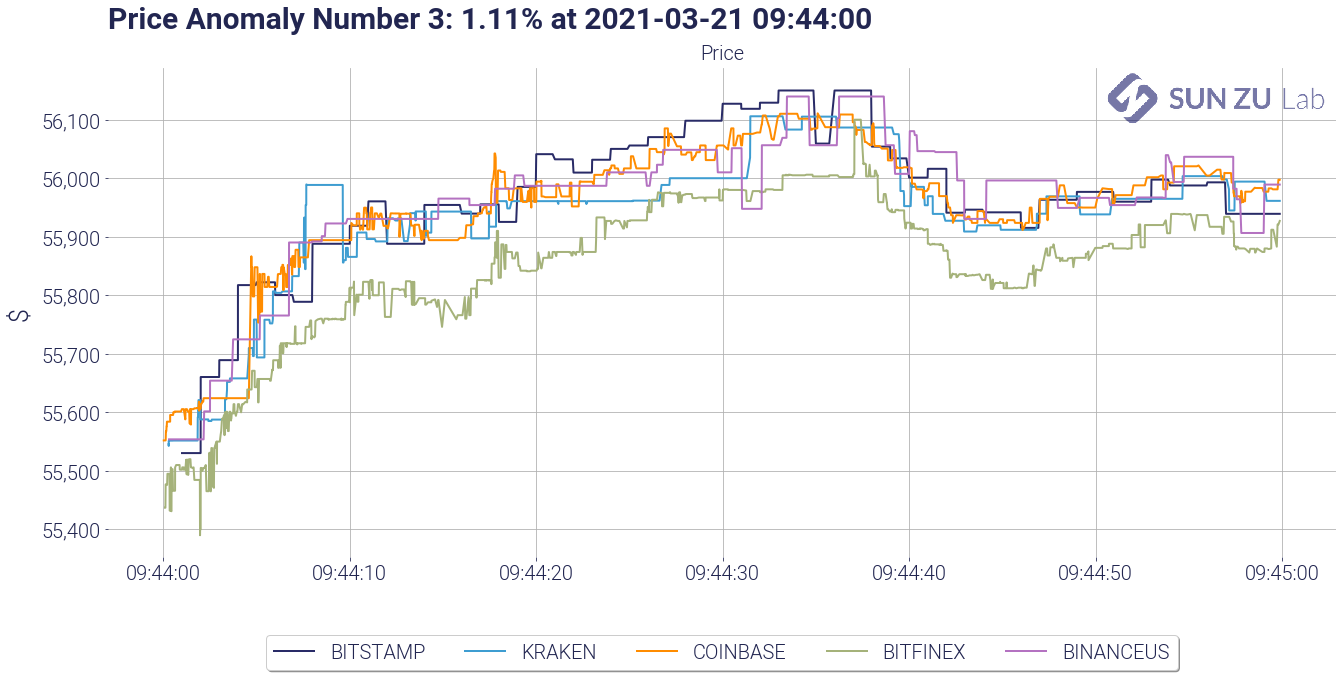
For the sake of curiosity, below are two more anomalies abstracted from our report. The reader will find the Bitfinex discount again, and long, recurring inter-venue price discrepancies. NB: the last anomaly is one detected through our volume filters, hence labeled “volume anomaly”. Volumes on Bitfinex appear as extreme outliers, accompanied by price dips that have a very small impact on other venues.
Price anomaly #2: +1.11% on 3/21/21 between 09:44 and 09:45 UTC
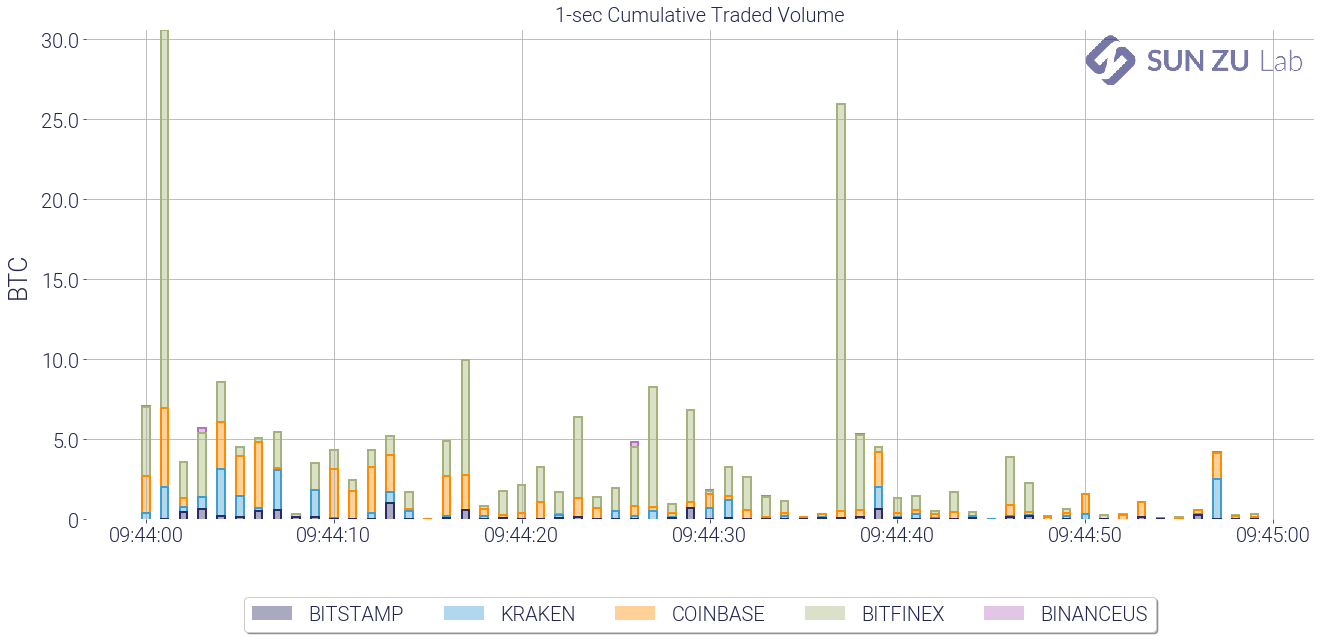
Volume anomaly #1: 706 BTC on 3/21/24 between 22:15 and 22:16

Well, we knew digital asset venues were not so closely integrated, but here we have a very detailed view of anomalies that are curious and result in significant price discrepancies. To track some of those anomalies regularly, we will produce a weekly report incorporating the above results (and more!) for BTC as well as other digital assets. Investors seriously curious about cryptocurrencies and digital assets may find in those a way to monitor market efficiency and as it evolves through time and across trading venues.
If you want to follow our research and efforts to shed light on all things related to the liquidity of digital assets, register for a 30-day free trial on our research, consult our website, or contact us. Feedback and comments are always welcome!
Our take on the liquidity of digital assets
A more systematic approach to liquidity monitoring
We at SUN ZU Lab have a deep curiosity about digital assets. Like everyone else, we follow bitcoin’s saga, with a volatility which, after all, is probably regarded more as a source or opportunity than a risk to be curtailed.
As we have written before (here and here), if digital assets were to constitute only a new source of liquidity, they would be an invaluable development in modern finance. Whoever has spent time on capital markets knows that liquidity is an elusive target at best. After decades of electronic trading, intense innovation, and regulatory adjustments, attracting and retaining liquidity remains as difficult as ever. Exchanges and trading venues worldwide know it firsthand, their primary responsibility is indeed to attract liquidity, one way or the other. Many have adopted “market-making” schemes whereby they basically waive fees and sometimes actually pay for participants to contribute orders in their central order book.
Liquidity is defined as the ability to rapidly buy and sell a product for significant size without adverse impact on its price. Note that this definition is not limited to financial products. Real estate for example is a very illiquid asset class. There is a constant trade-off between the time it takes to conclude a transaction and price improvements each party is willing to concede.
Liquidity is a very desirable feature on any developing market, and digital assets are no exception. If the price of bitcoin catches the front news almost every day now, reported trading volumes are also a big part of the story. Taken at face value, those suggest that bitcoin is at least as liquid as some of the most heavily traded traditional instruments (see here and here for a more detailed analysis on the subject).
Even though this is most certainly not true, in great part because volumes are massively manipulated (an x10 factor is commonly hypothesized), the bottom line is that public attention for bitcoin and more generally digital assets is bound to translate into more and more trading activity i.e. more liquidity. In fact, most of it may not even be visible: as investors stand by for the right price to buy or sell, they do not necessarily register their interest with a broker or on the order book of an exchange.
Where is liquidity to be found? There are dozens of venues, on-chain, off-chain, centralized, decentralized. Which venue should you turn to to find the most liquid market? Should you trade on several markets, if so which ones? What price and/or size can you expect if you include 1, 5, 15 markets in your shopping list?
Those are fundamental questions for investors, retail and professional alike. The marketplace is evolving so quickly and in so many different places that it is virtually impossible to follow all relevant developments. That’s where we at SUN ZU Lab, want to help. We started out with a mission: promote a truly institutional standard in the analysis of digital asset liquidity. Our quantitative research is meant to offer a dissected view of liquidity in time and space, so interested parties can get a sense of macro and micro trends to make better-informed decisions for their trading flow.
We had to start somewhere, so we decided to launch our product on BTC, including for the time being 3 markets: Coinbase, Kraken, and Bitstamp. We will be producing 3 reports: one on liquidity, another one will look at market integration (i.e. the existence of price discrepancies between different venues), and the third at what we call market anomalies (i.e. events for which price or volume is an outlier). [Register for our newsletter if you want to hear from us and receive a free sample!]
Let’s look here at the liquidity report. It is a quantitative dissection at liquidity over a 2 week period and will be produced twice a month. Our intention is to present rigorous information to qualify and quantify liquidity dynamics both intraday and over the observed period.
Here is the list of indicators we look at, abstracted from the report over the last 2 weeks in January:
- price and volume-at-price:
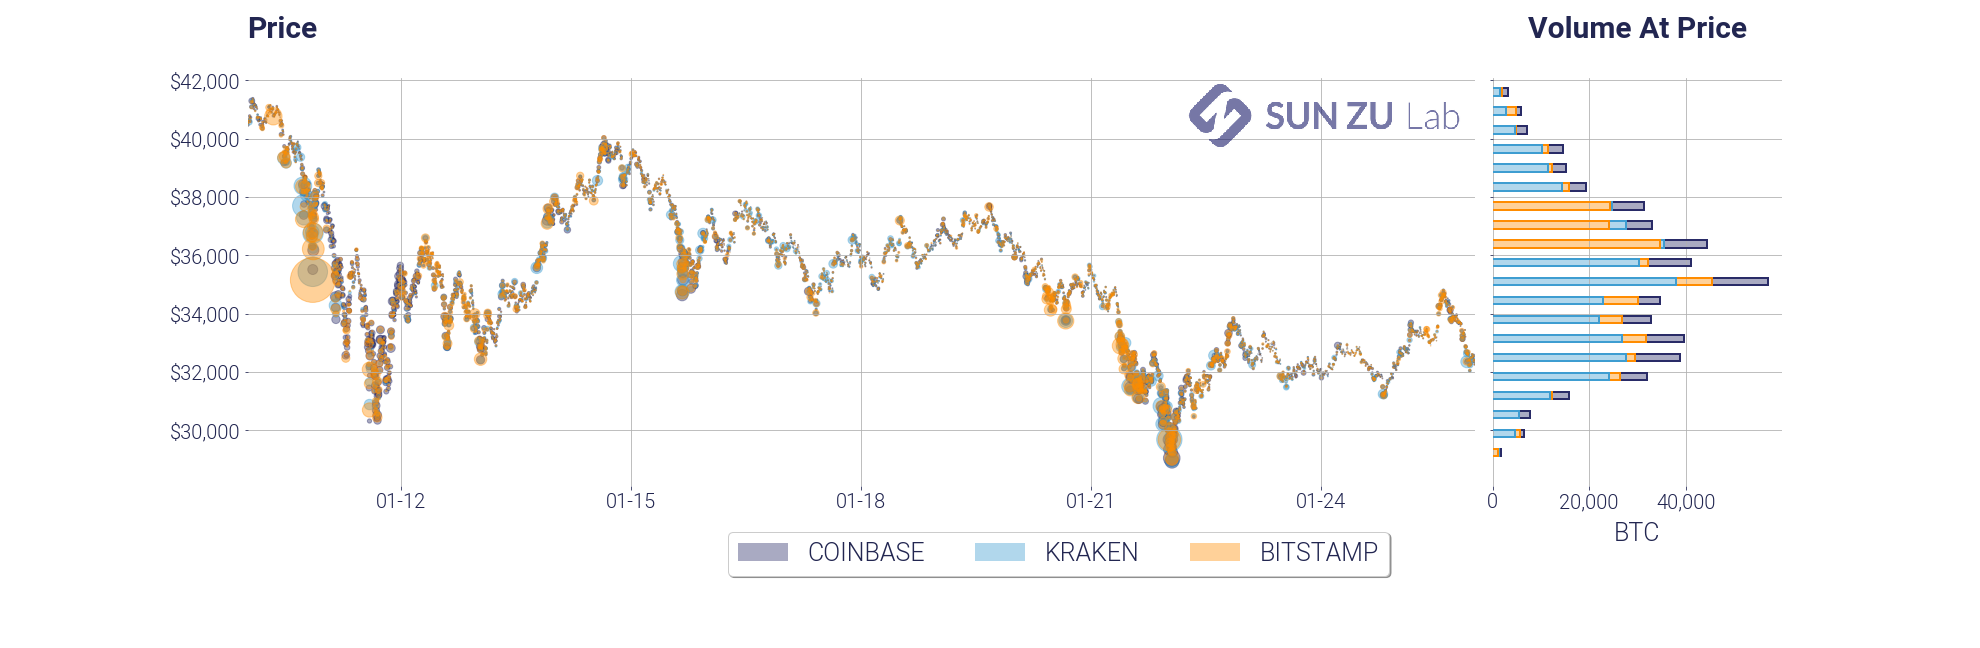
This chart is a necessary introduction, we absolutely need to have a sense of how the market has moved over the period, and at what price points have traders concentrated their activity. The volume-at-price add-on on the right side is an elegant way to present this information.
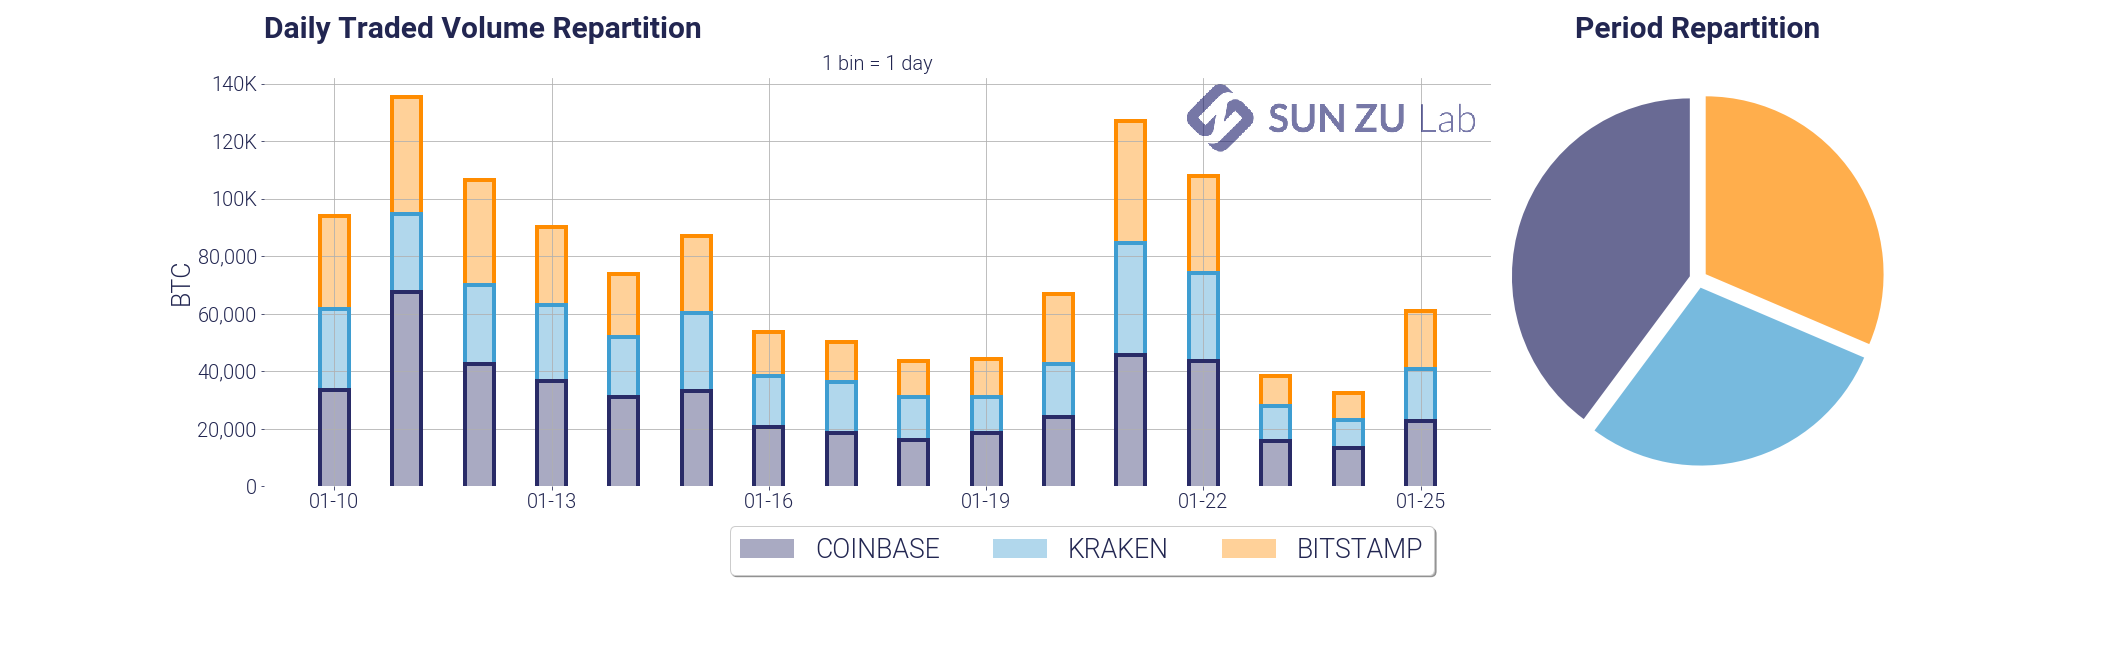
- traded volume, overall and by venue (daily and intraday):
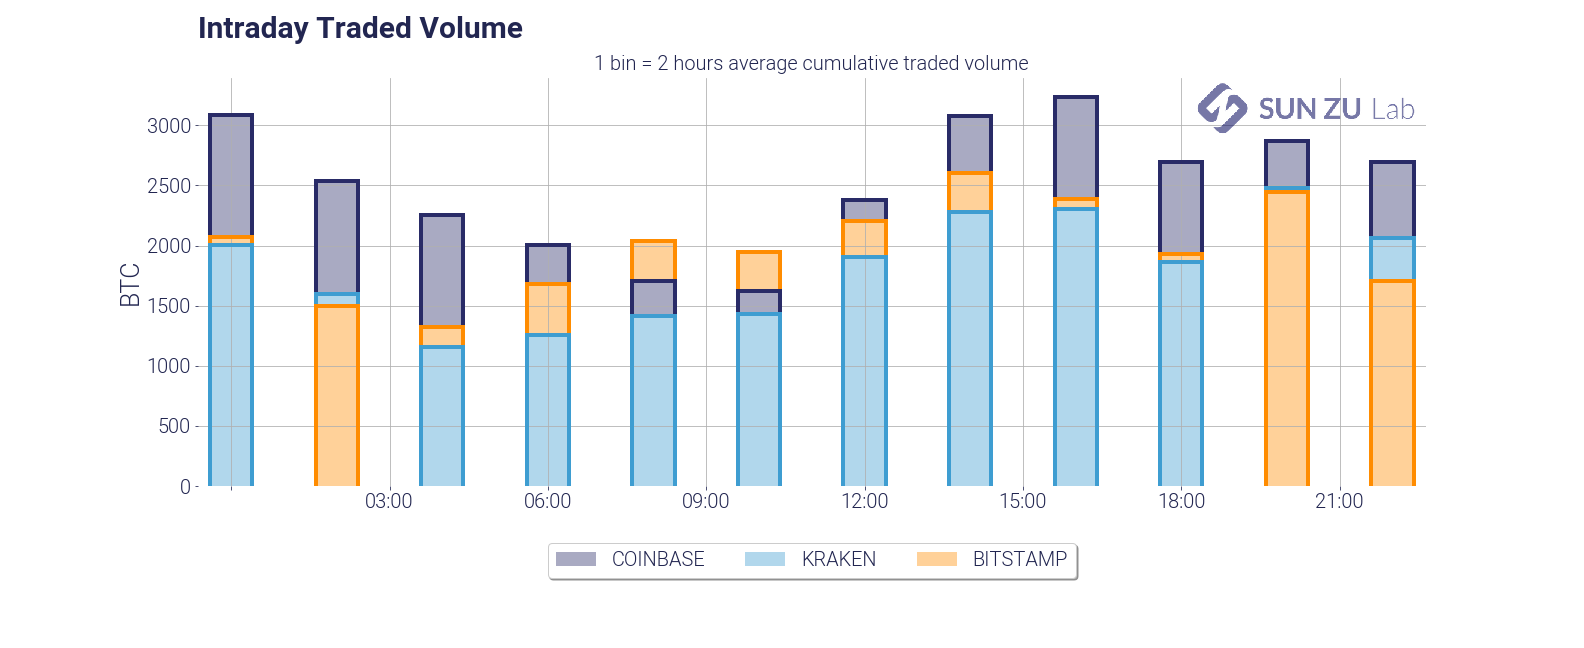
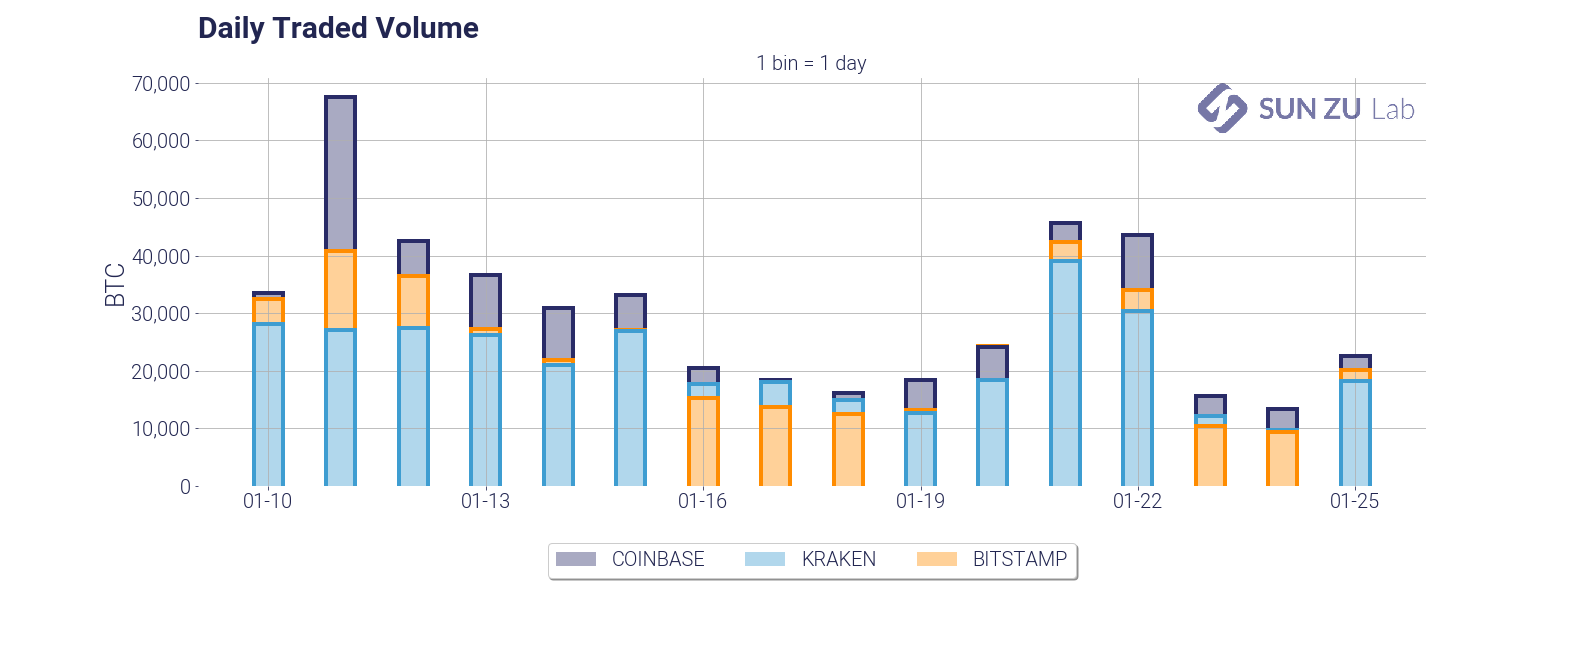
Those two charts are fairly standard representations of volumes. We present both views to determine whether there are intraday patterns that have developed over the observed window. In particular, we could expect higher volumes when Asian and/or US markets open. Quite naturally we need to address also the question of the relative partition between exchanges:
- daily and intraday annualized volatility:
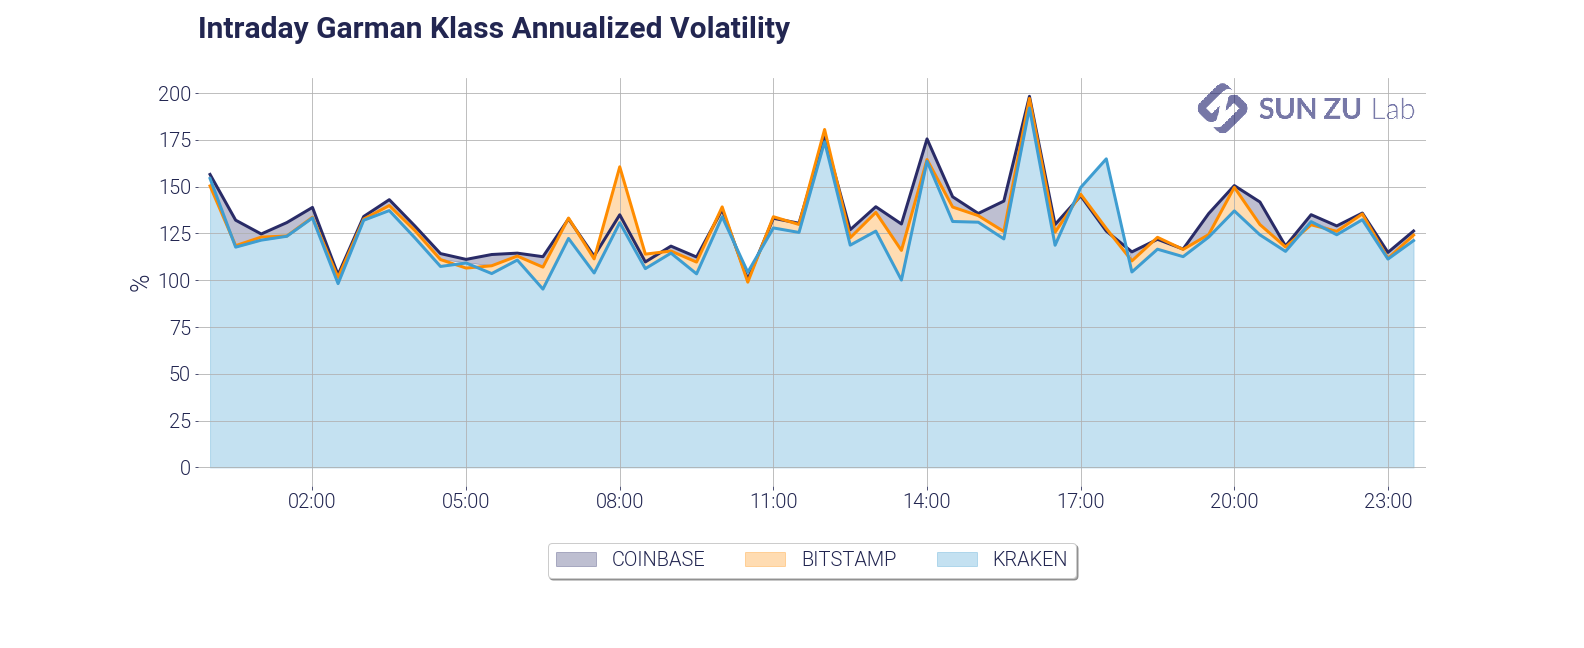
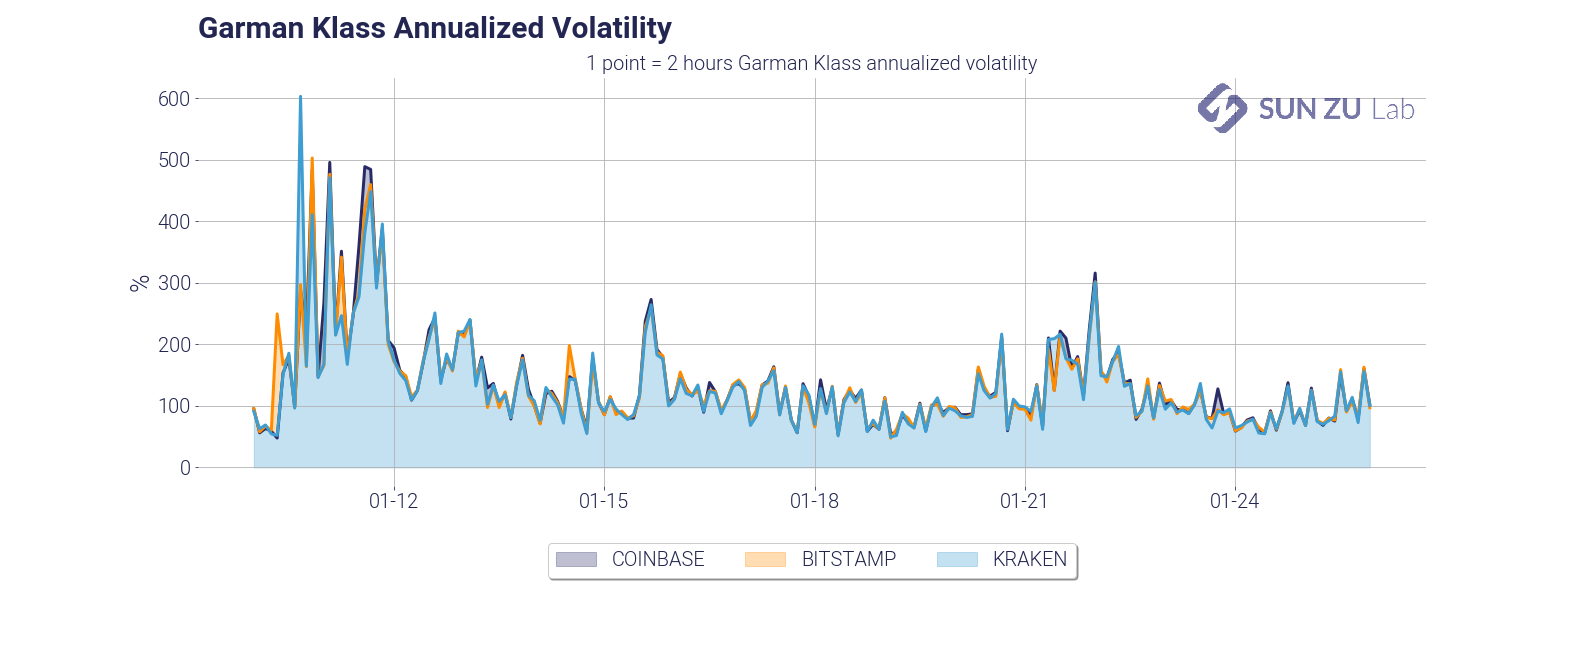
Similarly to volumes, we plot both the intraday and daily volatility to monitor whether intraday patterns developed. Despite the fact that the charts are very similar on distinct venues, we decided to keep them all, to make anomalies between markets stand out, should some come up.
- mean and median trade size (daily and intraday):
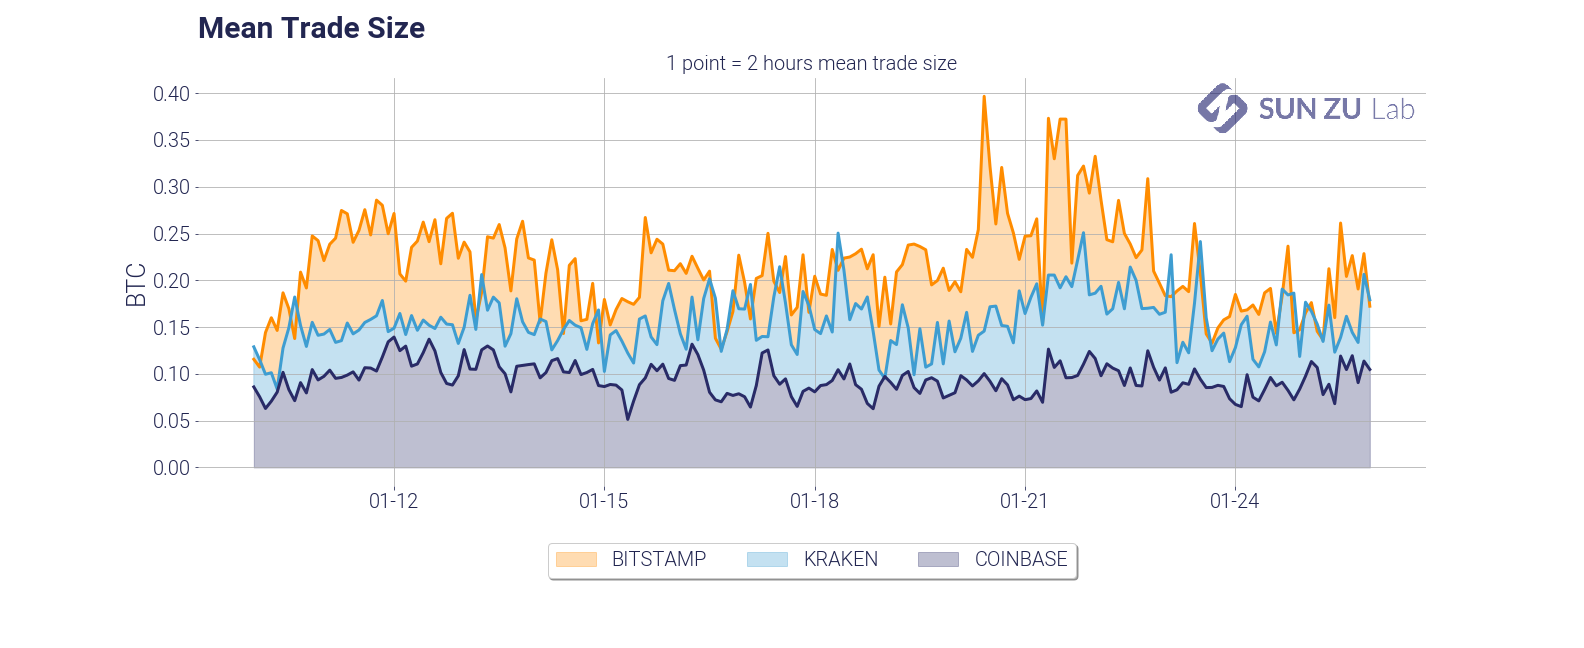
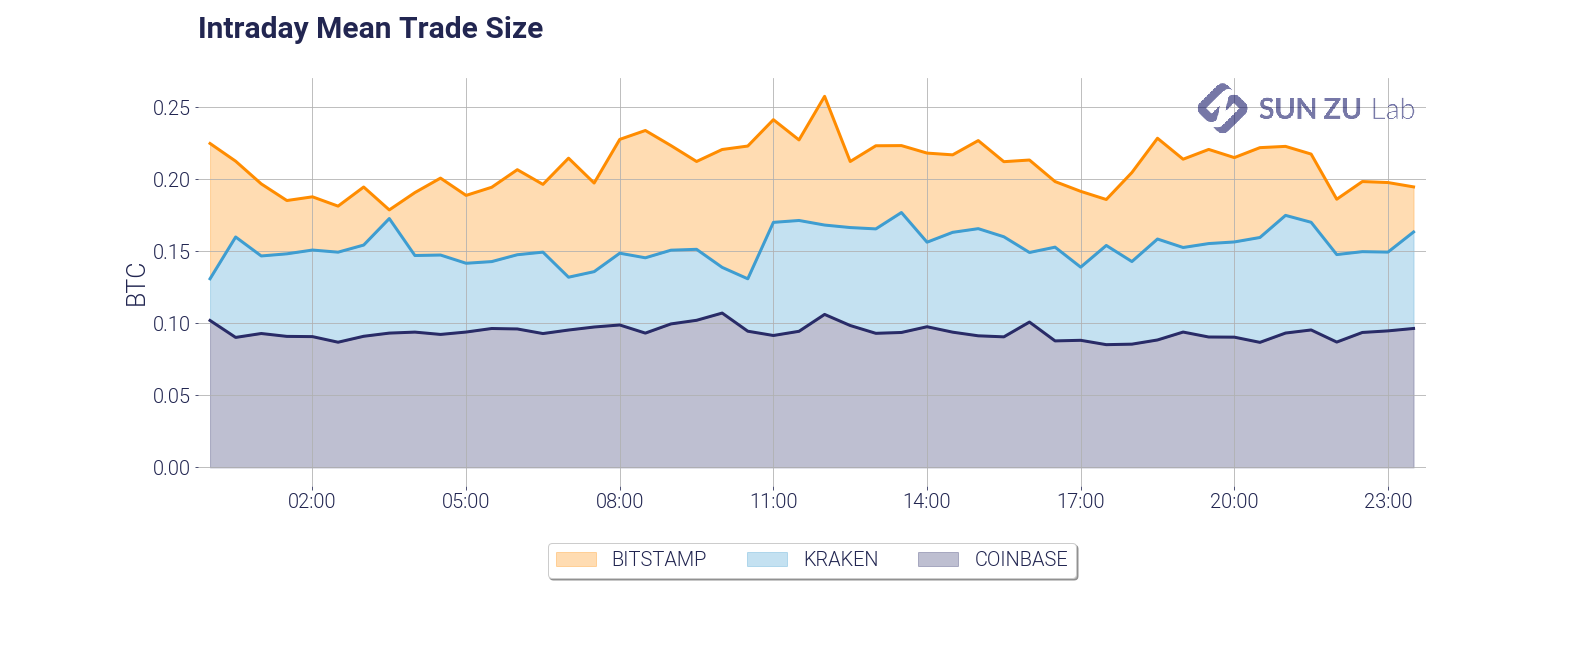
The average trade size is a very important feature of liquidity dynamics. It is dependant on a number of factors, such as the type of investors (retail, institutional), the pricing structure of the exchange (fixed vs. variable fees, caps on per-order fees), time of day, etc. We found in our research that infrequent large trades tend to alter the readability of the average, therefore we decided to include the median as well:
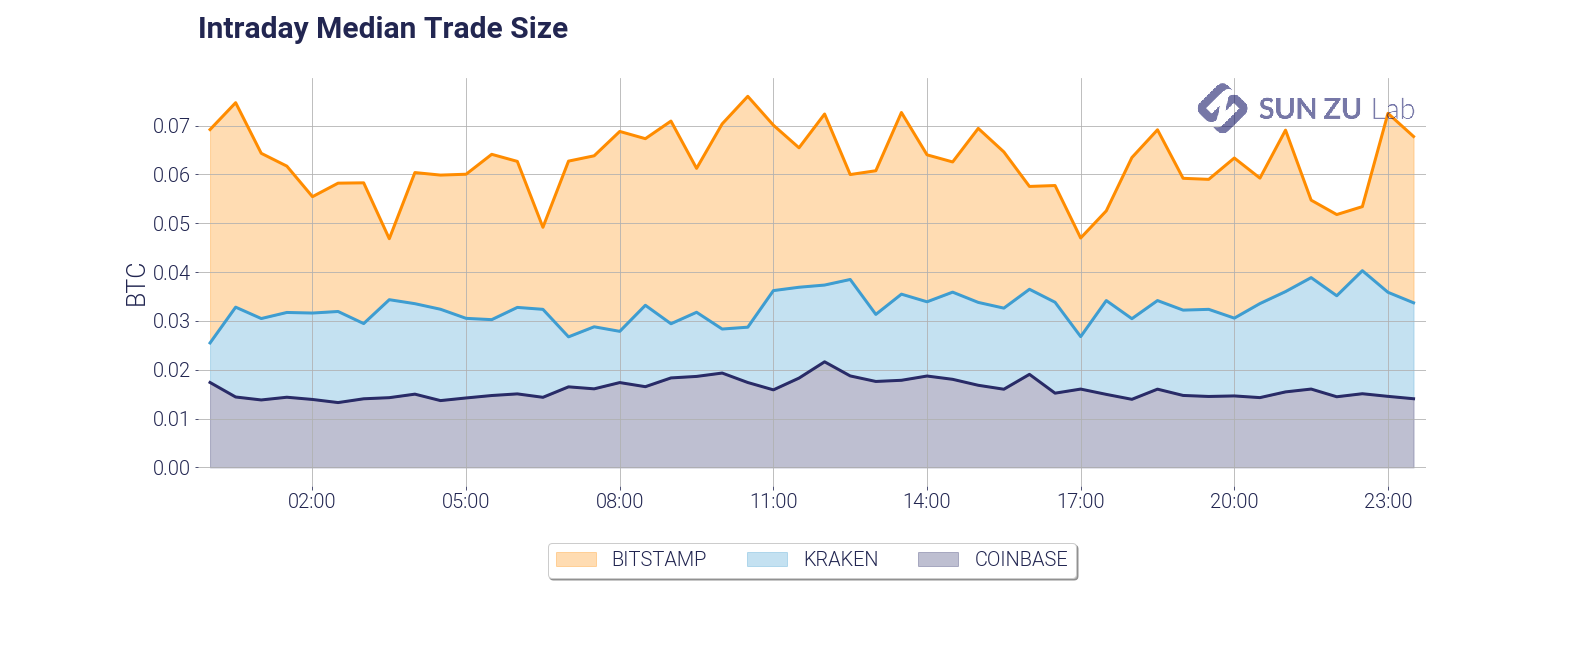

Believe it or not, we think there are many more questions that we should be asking. For example: how does trade size vary with volatility? with the bid-ask spread? We will absolutely incorporate the relevant metrics to answer those questions in due course.
- daily $10M and intraday $100K participation:
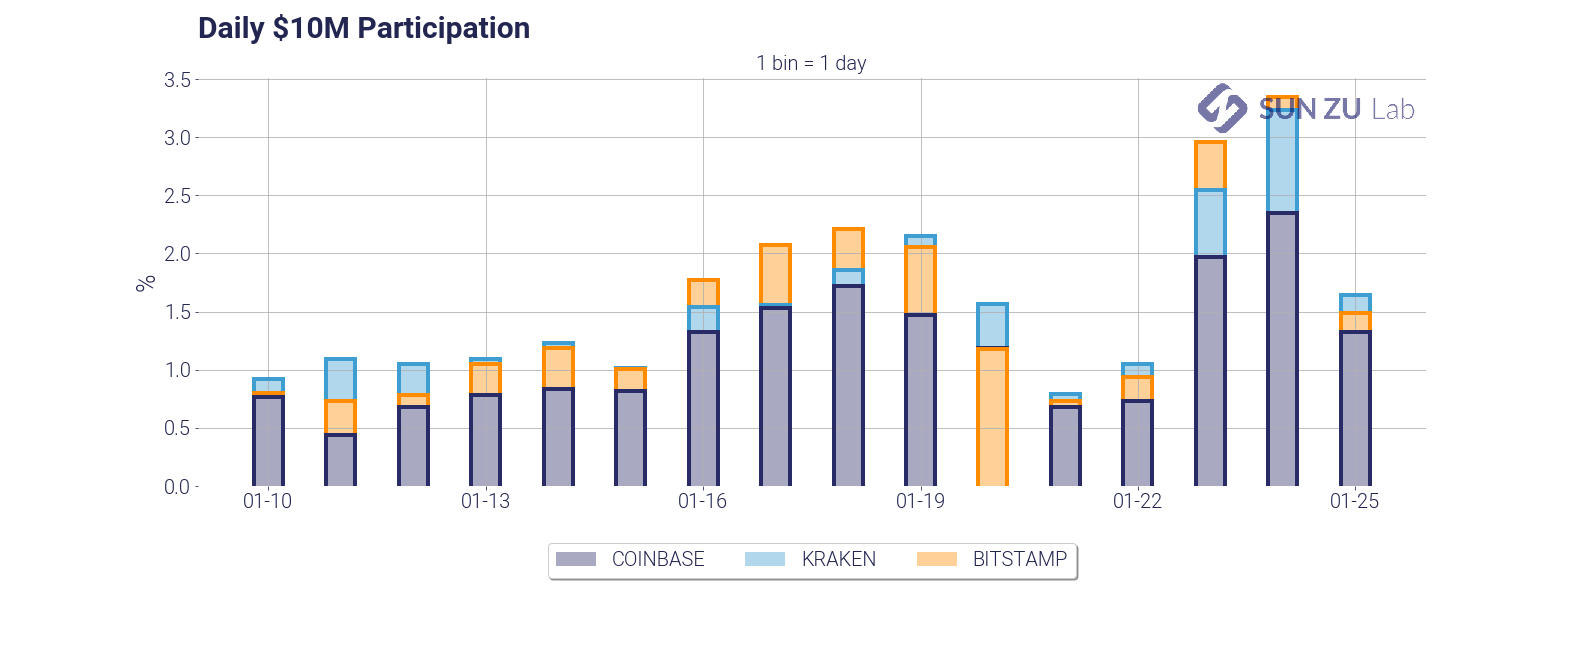
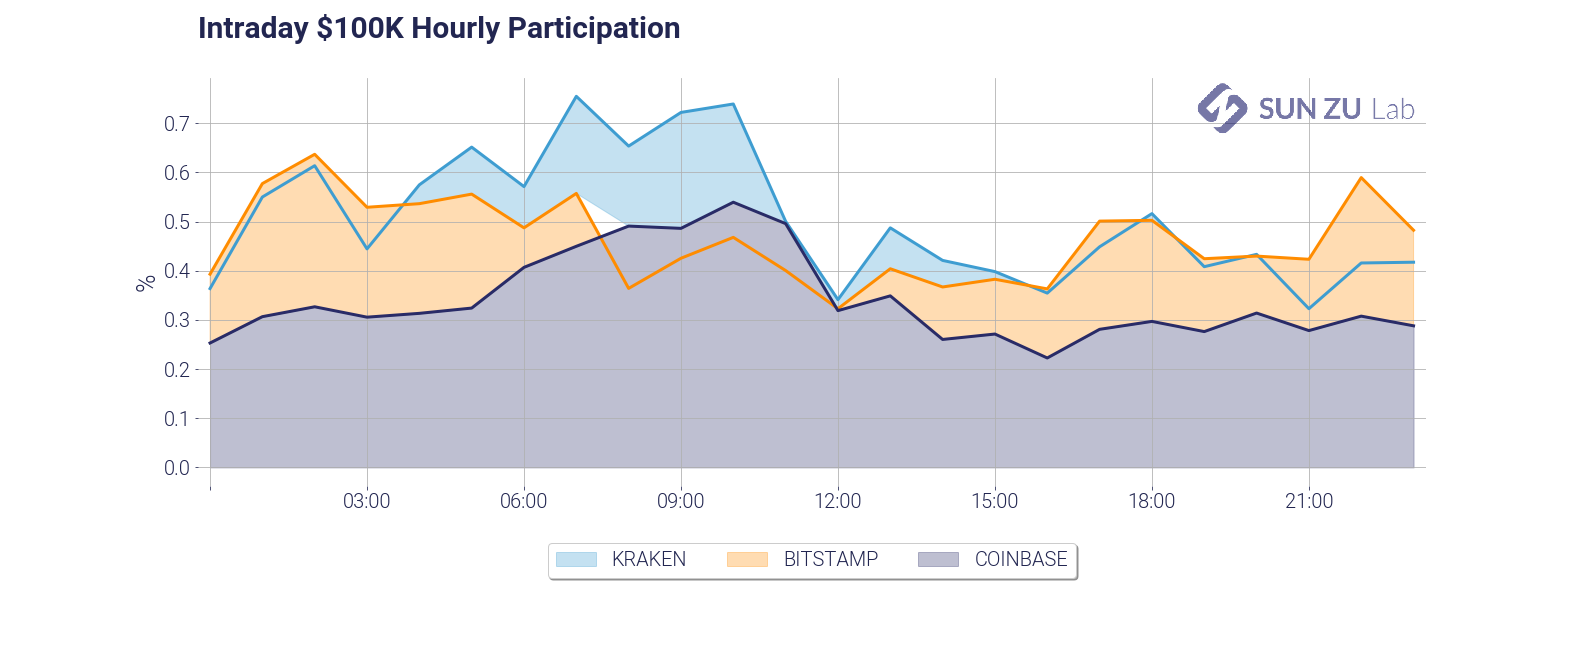
Those two charts give two measures of market participation. First, we answer the question: how much volume does it take on a given day to fill a $10M order? As you can see it takes anywhere from 1% to 3% of the daily volume, on each exchange taken independently. Practitioners in traditional markets advise their clients to never cross the 15%~20% threshold. In the case of BTC on those three exchanges, roughly 10 investors with a significant order would be enough to “drain” available liquidity. The second chart is an examination of the same question, with a shorter time frame (1 hour), and a smaller size ($100K). Markets seem to be amply capable of absorbing repeated $100K orders.
- intraday market impact of a $100K order:
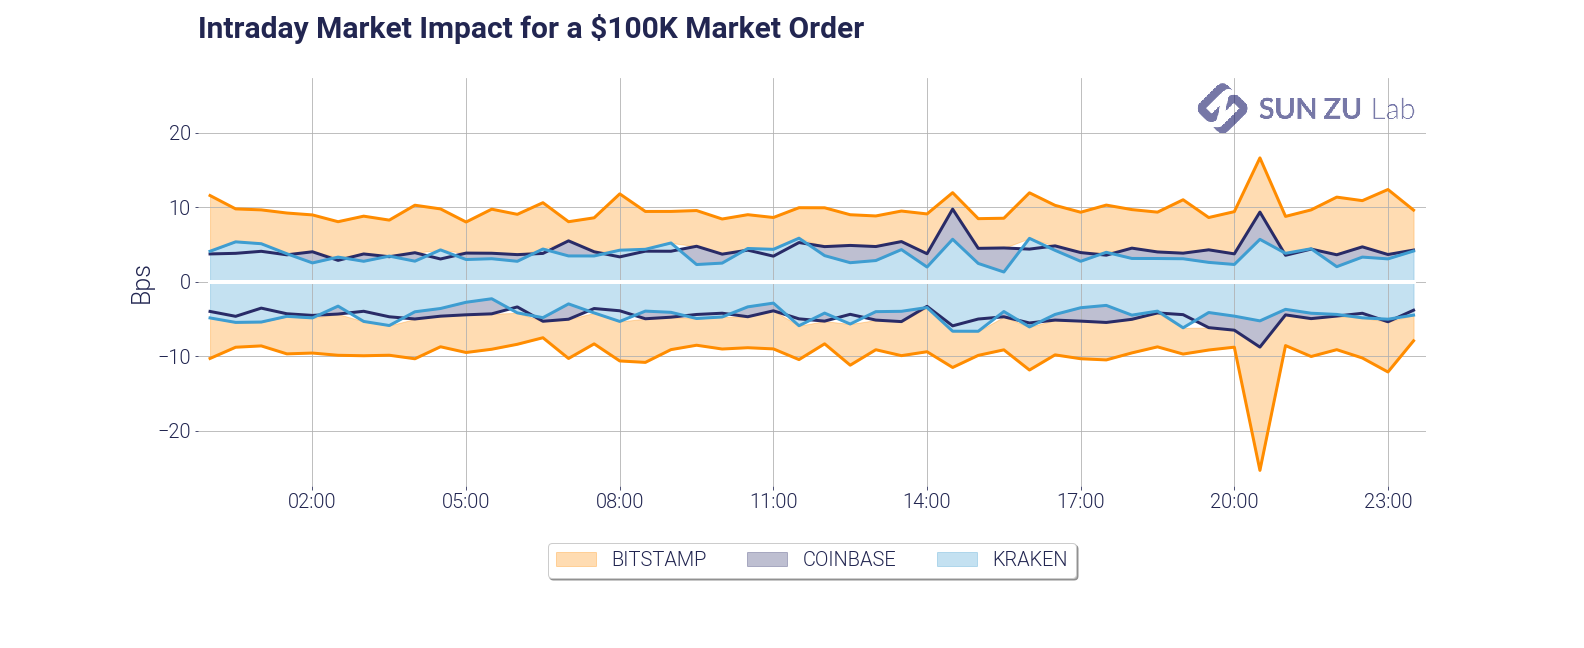
This chart is a slightly different take on market impact. It answers a different question: how much adverse price movement would a $100K market order create? This gives a measure of market depth, which as you can see is fairly stable in time but quite different across venues.
- intraday ratio between traded and available volume:
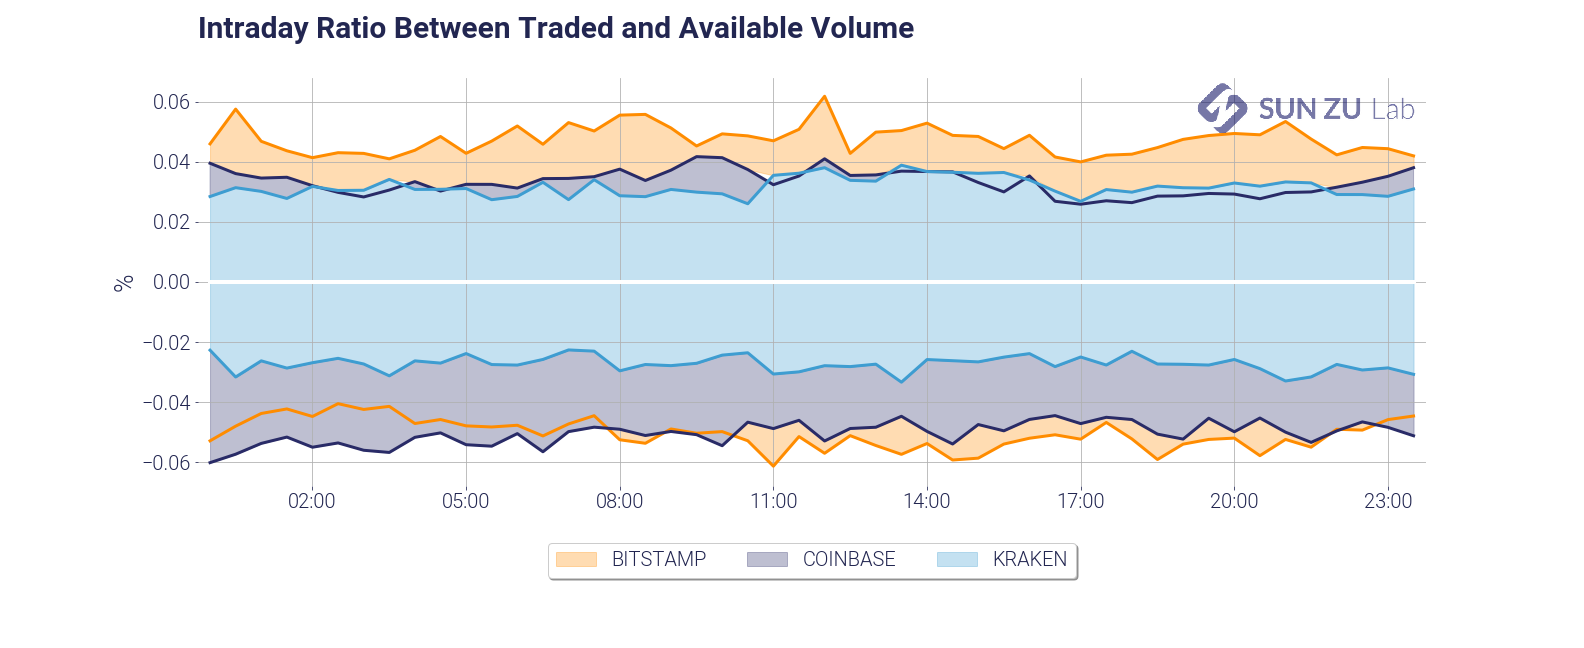
By definition, each trade “consumes” part of the visible liquidity. What ratio of the liquidity available is consumed, and how fast is it replenished? The chart gives an answer intraday. As can be seen, there seems to be a somewhat constant rate of consumption and replenishment, something which is somewhat surprising. Again, we will absolutely look at this in deeper detail in due course.
- volume at best limits (daily):
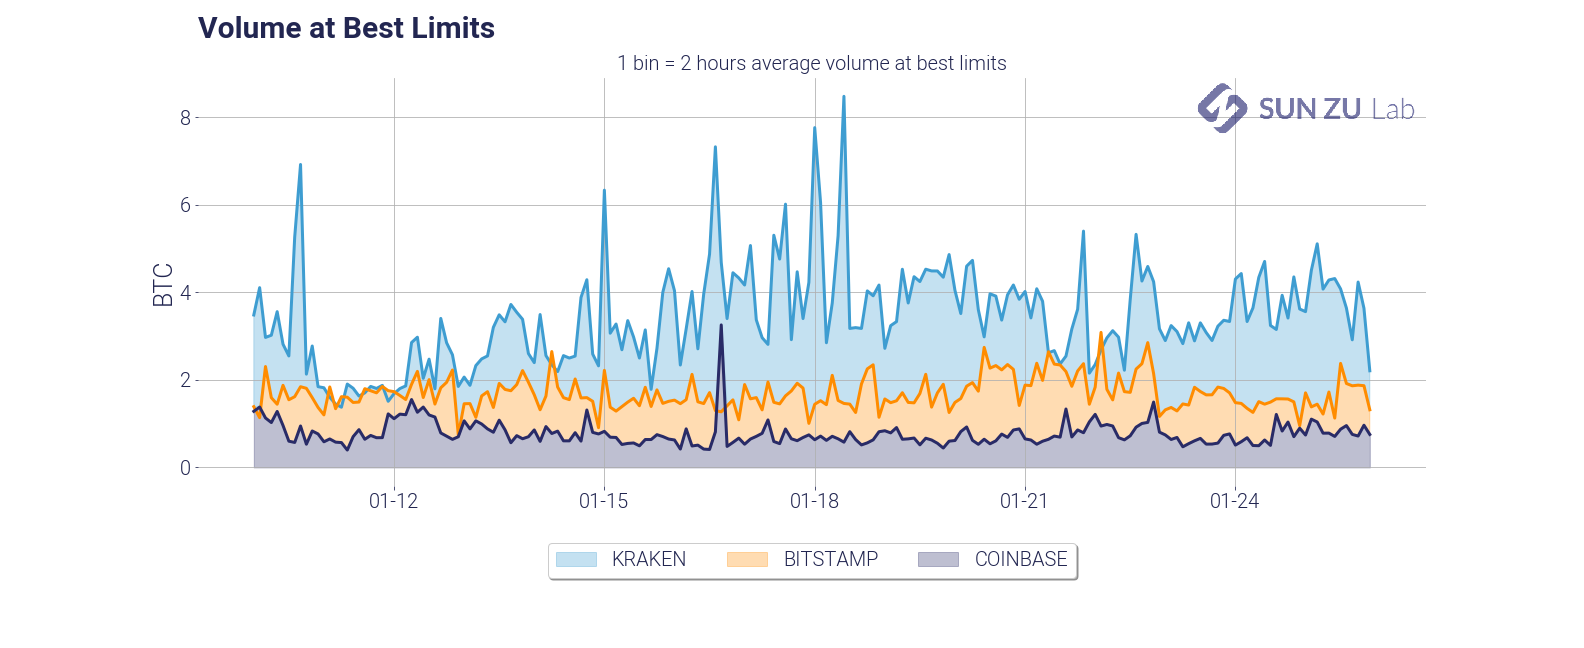
This chart presents a view of the total size available at best limits, in each of the individual order books. It is useful to monitor absolute levels of “aggressiveness” from market participants, and patterns in the overall migration, if any, from one venue to the next.
- intraday mean price difference and mean time between subsequent transactions:
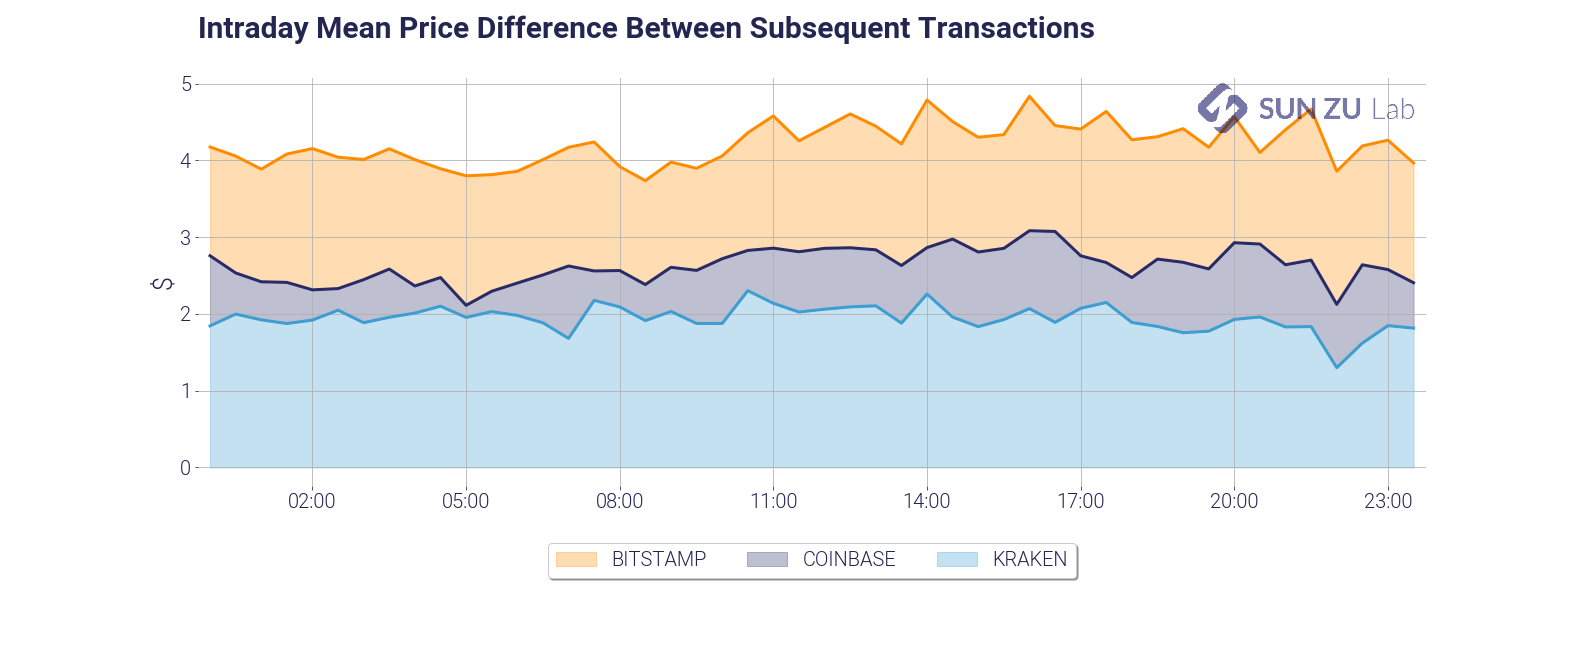
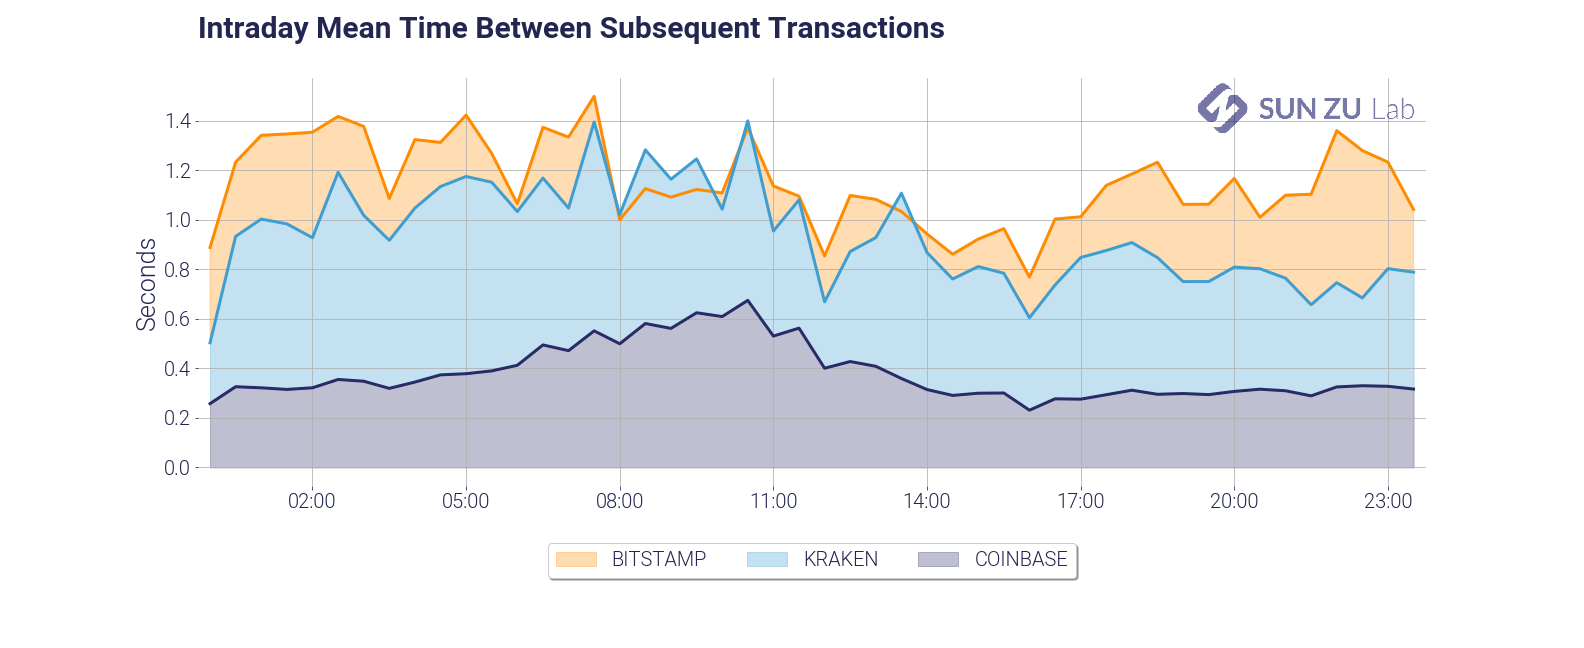
Those two charts present an introduction to order book velocity. Each venue has its core client base, and those may have very different trading habits. Those habits are also constrained by venue-specific factors such as commissions, API throughput, matching engine performance, etc. Investors may gain valuable insights by qualifying each venue’s reactiveness and specific velocity.
- limit order book distribution at +/- 100 bps and +/- 400 bps from mid-price:
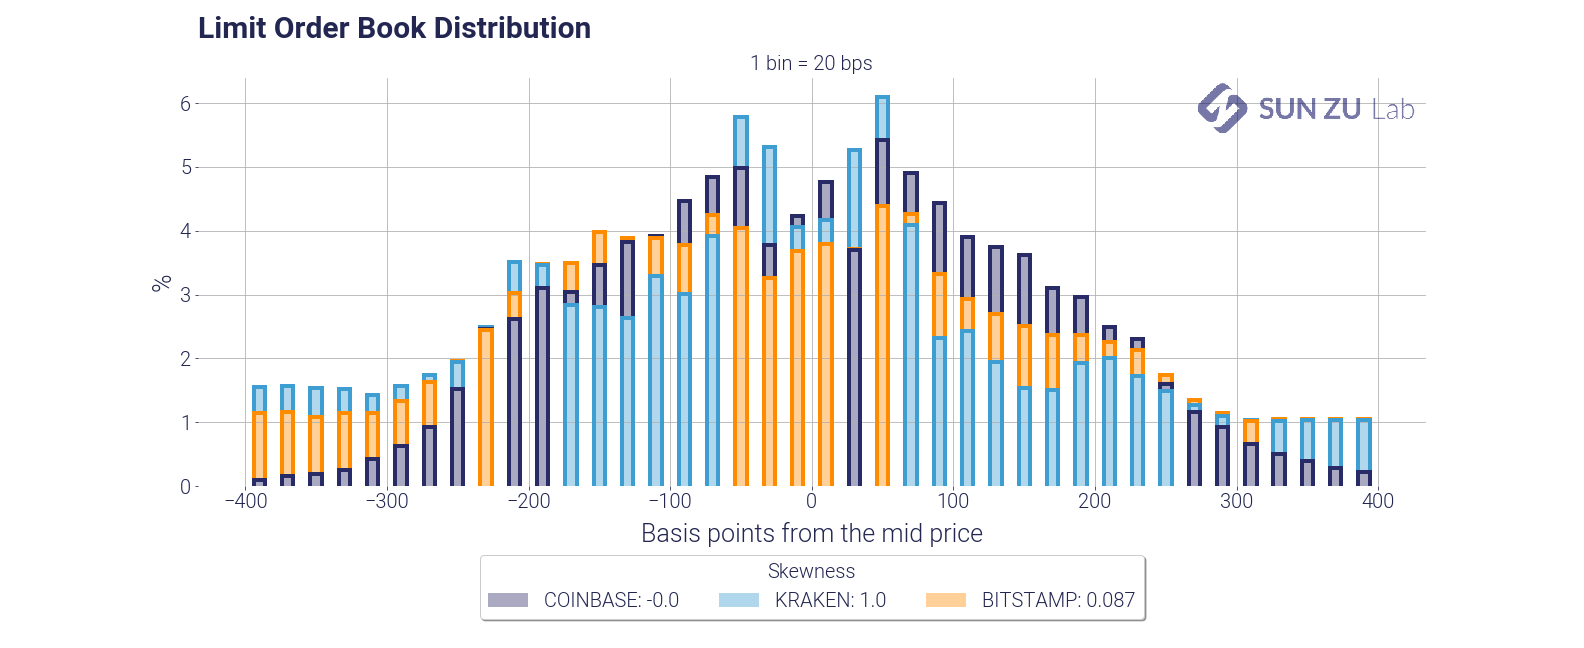
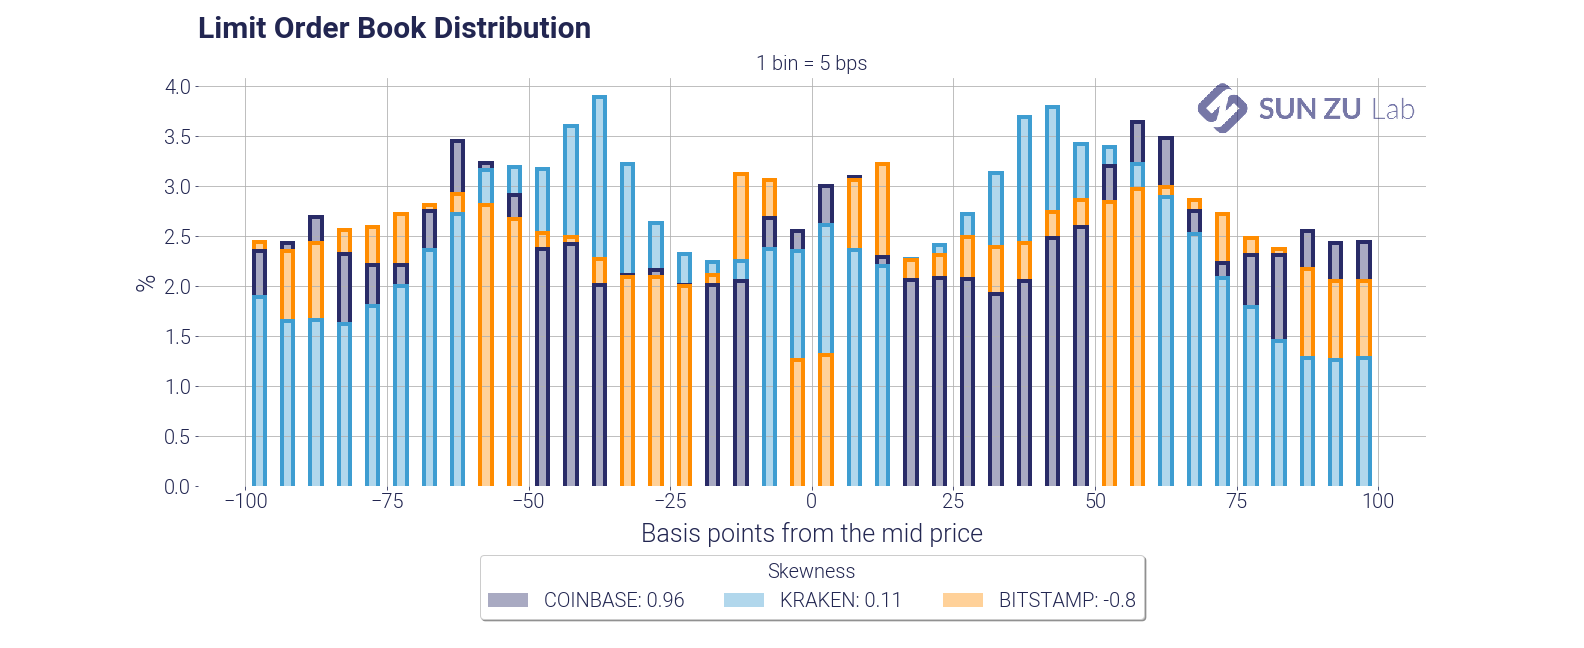
Those charts present the distribution of each order book around mid-price, for a depth of 100 bps and 400 bps. There is a wealth of information to be extracted from those distributions. Here are two examples.
First, they indicate how participants think about risk beyond the first limits: are they placing a lot of orders away from mid? if so, are those significant compared to the best limits?
Second, how does each venue compare? Am I more likely to find liquidity at 50 bps from mid on Coinbase or Kraken? What about 100 bps?
Market makers, speculators, institutional investors have very different trading strategies. Market makers may be interested in price discrepancies, which would lead them to participate symmetrically from mid-price. Institutions may be more buyers or sellers at different times. In each case, they would presumably occupy one side more than the other. Although the averaging in the above charts provides a lot in readability, it is also the source of much “compression”. We have a lot more to say on order book dynamics, and in fact, it will be the subject of an entirely new report soon!
- limit order book imbalance:
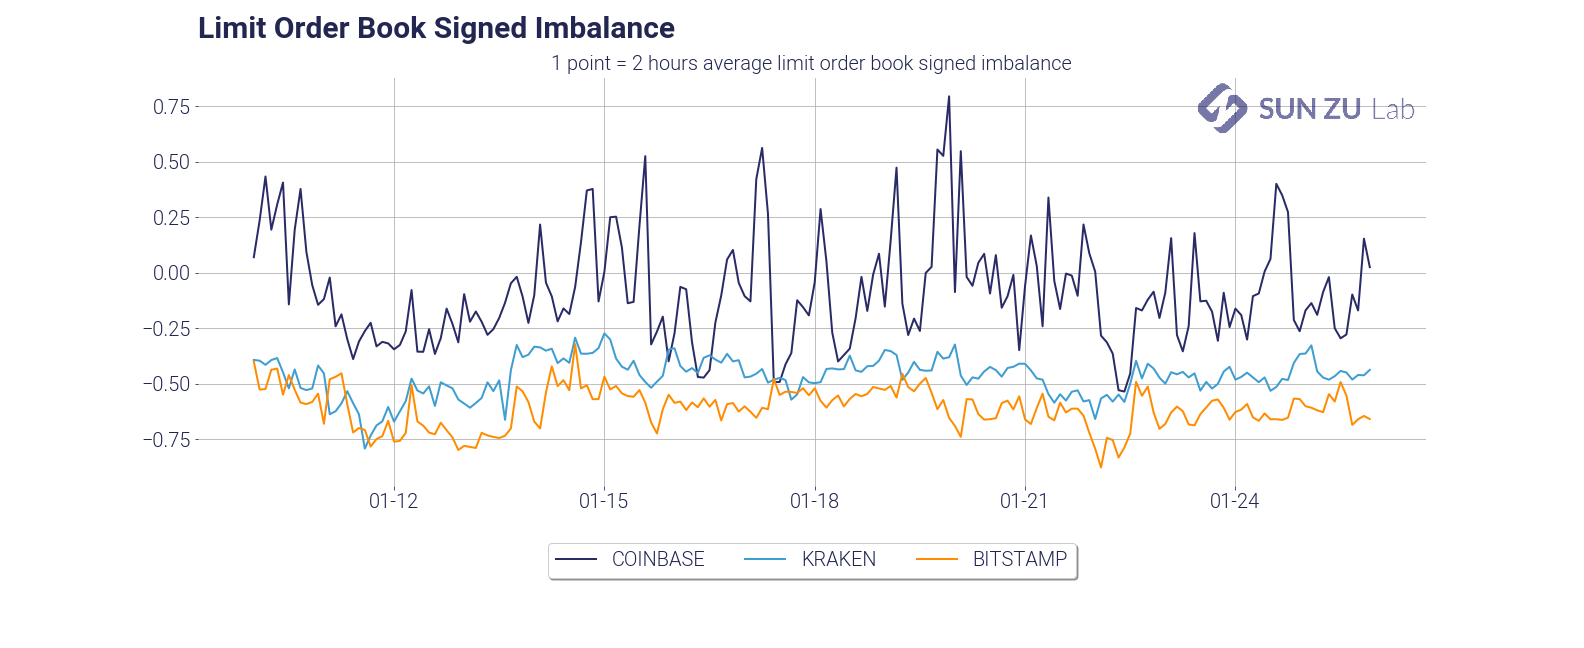
Popular wisdom would have that a trending market shows asymmetry in liquidity. Well, unfortunately, this is not quite as simple as that. The graph above represents the order book imbalance by trading venue. Order book imbalance is defined as (Qa — Qb)/(Qa + Qb), where Qa is the total quantity, available at 100 bps from mid on the offer, and Qb is the total quantity available at 100 bps from mid on the bid.
Imbalance oscillates between -1 and +1: a market with no bid (Qb = 0) has an imbalance of +1, and -1 for a market with no offer (Qa = 0). An imbalance close to 1 means the order book is dominated by offers and vice-versa.
It is very apparent that the three exchanges have very different imbalances. At 100 bps market depth, Coinbase is mostly an “offer” market (with variability), whereas Kraken and Bitstamp are mostly “bid”.
- average market depth:


Total visible liquidity is a very natural question: how many bitcoins are available in each order book? Those two charts present two different answers to that question. On the left, absolute size at 100 bps, on the right intraday depth at 10bps. Those can help provide first-order estimates of impact: 100 BTC can be executed with a max impact of 50 bps; at any time, an order of 10 BTC should not be filled more than 10~15 bps from mid.
- spread and weighted spread distribution:
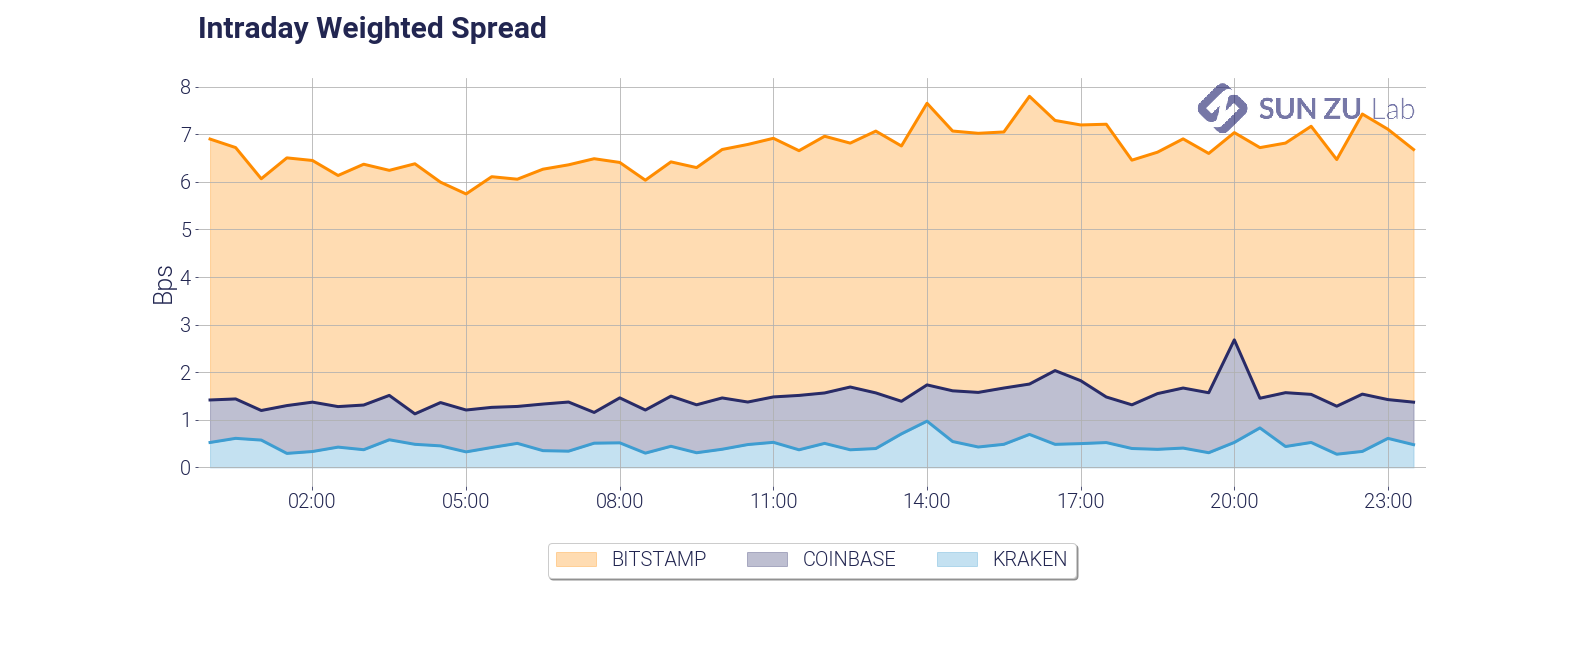
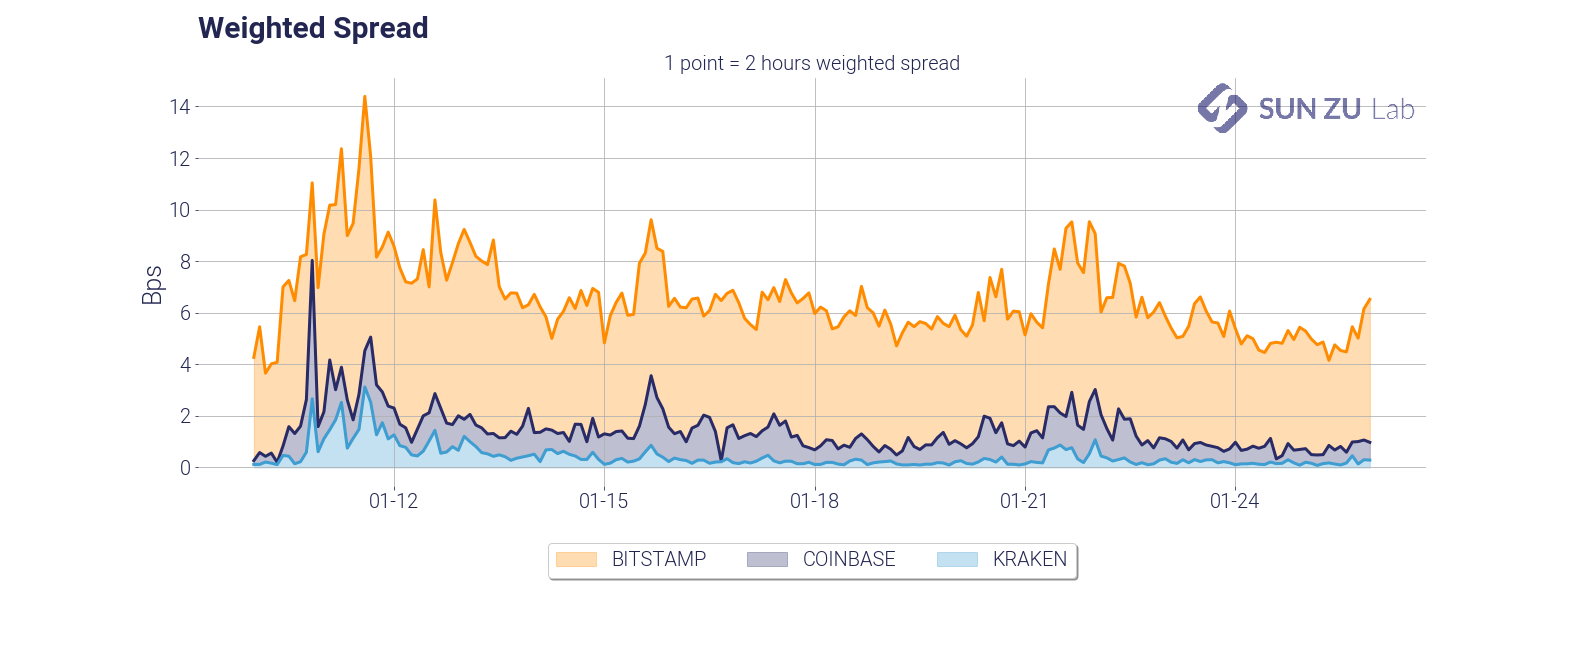
Of course, no study of liquidity would be complete without spread analysis. Above are time series of the weighted spread, showing intraday and daily dynamics. Unsurprisingly the weighted spread deteriorates quickly with volatility (early days in the chart). The charts below enable comparison between a simple spread and a measure weighted by the total quantity on best limits (bid + offer):
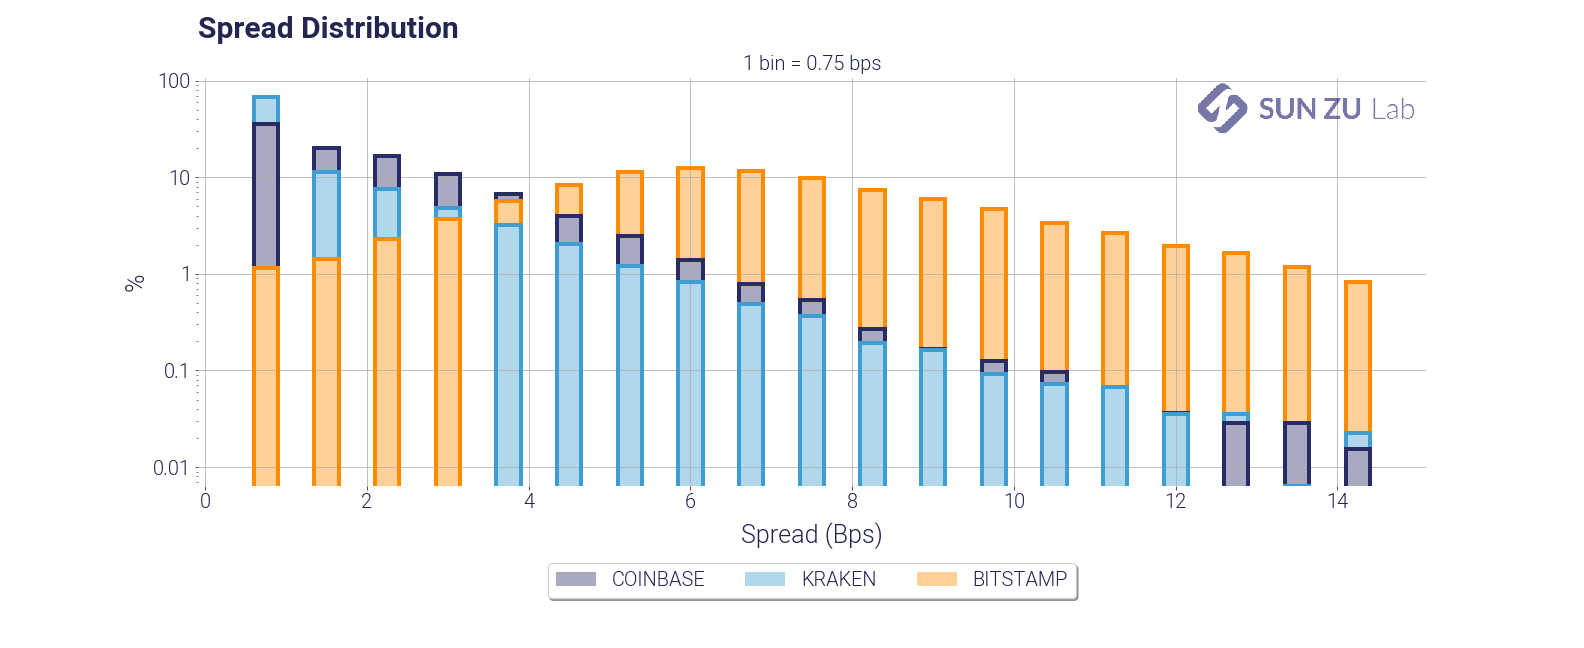
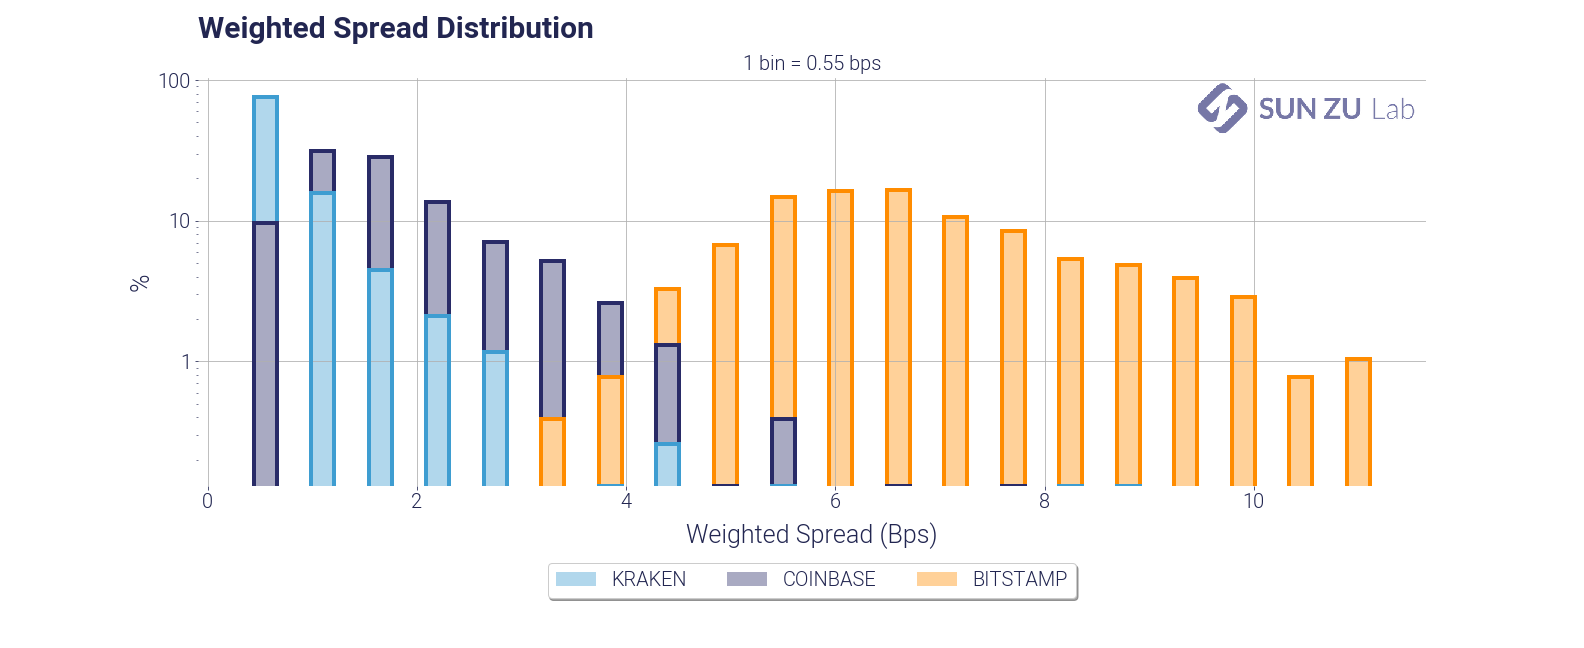
It can be seen quite easily that exchanges have very different order books.
Now this is a long list of charts and tables. You may get a sense that a lot of it is repetitive. We would argue that it is not, quite the contrary. As was said earlier liquidity is an elusive parameter, and in the world of digital assets it is bound to evolve very quickly. Monitoring and understanding it appears to us an important prerequisite for traders already active in the space, or even for “crypto curious” i.e. investors or institutions interested in the subject but not yet in a position to transact.
What is prime brokerage and how does it apply to digital assets?
There is a lot of talk in the crypto economy about prime brokerage: many participants frame themselves as “prime brokers” (PB), with the usual superlatives. What exactly are we talking about? A broker is an intermediary between a buyer and a seller: for a multitude of reasons despite the costs involved, it often makes sense to “intermediate” a transaction. This is the case for corporate mergers & acquisitions, real estate, a large fraction of products in capital markets, auctioning art, etc. But what are the prime services offered by a broker beyond execution (i.e. the matching of buyer and seller)?
In traditional finance, prime services include the following:enhanced execution services: those may be for example access to a low latency environment, co-location at an exchange data center, custom-made trading algorithms that may not be widely available to the broker’s client base, etc. In some instances, a PB might even allow a client to trade under the broker’s membership for better performance and/or lower costs.
- custody of assets: this is fairly customary, most broker-dealers offer custody services as part of an integrated solution (but sometimes using a distinct legal entity). Client accounts may be co-mingled (all in the same place) or segregated (in individual accounts). Co-mingling assets is practical and cost-effective for the PB (for example for settlement and delivery) but presents an element of risk for the client (in 2008 some of Lehman clients discovered that their assets were not segregated. As a result their claims was much harder to enforce in the liquidation proceedings). Segregation dramatically facilitates property claims in case of default but is regulatory and operationally more costly.
- operations: commonly referred to as “back-office”. A PB will make its back office available to address the settlement needs of its clients, from basic cash and derivative settlement to OTC reconciliation, margining, and corporate actions. Back-office operations are a very tedious universe. While many operations are “straight-through”, a lot of situations arise that need manual intervention. A PB will essentially allow an investment fund to outsource all its “ops” department, thereby significantly reducing its fixed-cost base.
- portfolio valuation: third-party valuation is a basic requirement in the world of asset management. PBs fulfill that need for their risk monitoring requirements but also the benefit of final investors.
- funding (i.e. secured lending): that’s a big one. A lot of asset managers, especially speculative hedge funds, employ leverage. The principle is quite simple: the fund borrows money to buy assets, those assets are then deposited as a guarantee against the loan. The interest rate paid for this loan reflects the type of assets, their liquidity, and naturally includes a commercial margin that is client-specific. Funding is a very important part of a PB revenue mix because of its diversifying nature. Execution is a transactional business: no trade, no gain. Funding is an accrual stream: the simple carry of a position brings revenues day after day until the position is unwound.
- short-covering: for a portfolio manager trying to gain a short exposure in the market, the pre-requisite is finding the right instrument to build this exposure. Today “naked short-selling” -i.e. the sale of an instrument without having secured the possibility to deliver- is mostly forbidden. For example, a stock cannot be sold short if it hasn’t been “located” to borrow prior to the sale. Being able to locate inventory at a fair price is a critical competitive advantage for PB. A client can naturally request a locate from intermediaries other than its regular PB, but the cost is most certainly higher and practicalities can be tricky (on-time settlement for example).
- regulatory reporting: not much to detail here. The trend is towards more of this, outsourcing this function is a no-brainer for many clients.
- risk management and reporting: risk management is naturally a function of each client’s strategy and mandate. There are three reasons however why PBs have stringent risk management practices in place: i/ they need to make sure that they can survive a client’s default, and if possible even anticipate it so that market-wide damage is minimal; ii/ in the presence of leverage, there is a credit element to risk management: a sudden market drop could result in dramatic losses because of leverage; iii/ regulators impose it, implicitly as a way to overlay a third-party risk monitoring layer. Many hedge funds are unregulated: final investors and regulators can find reassurance in the fact that well-established PBs keep a close eye on their risk engagements.
- fundraising: because of their extensive connections with final investors, institutional and otherwise, PBs routinely help their clients find new money.
- synthetic format: prime brokerage was historically a cash business i.e. clients would physically buy and detain the assets. With the development of derivatives, a new format emerged: “synthetic prime brokerage”. In a synthetic arrangement, the client doesn’t hold the assets. Those are on the PB’s balance sheet and the client holds a derivative that mirrors the portfolio’s exposure — it usually takes the form of a total-return swap (TRS). The synthetic format offers many advantages from a client standpoint, in particular its simplicity. However, this simplicity comes with an additional layer of legal complexity due to the fact that a derivative product is involved.
Now, what about the crypto space? Are prime brokers there close to providing prime services to their clients? Not by a long stretch. One could argue that there are in fact only very few true prime brokers for digital assets. Some functions are highly relevant (e.g. execution), some don’t even have an equivalent, for example regulatory reporting which is non-existent (today).
The most fundamental interrogation is this: do digital assets possess intrinsic characteristics that would prevent nascent digital capital markets to grow and converge towards their cousins on traditional instruments? Well, at SUN ZU Lab we don’t think so, quite the contrary. In principle, we think digital assets have tremendous potential to equal and even surpass some traditional assets. With two caveats:
- the industry needs to aggressively embrace self-discipline if not self-regulation: conflicts of interest are widespread, opacity is the rule, not the exception. Embracing self-regulation will promote cooperation and contribute to forging a common vision. In turn this vision will help consolidate relevant technologies, and forge a path to much needed standardization.
- market participants need to make peace with traditional regulation. Not all of it is relevant or applicable, but regulators worldwide care about only one thing: protecting investors, especially non-professional ones. The digital asset industry need to recognize this fact and make it its mission to help.
Liquidity and order book distribution
When we formed the team to launch SUN ZU Lab, we had mostly one question: how liquid are crypto-assets, and if there is indeed liquidity to be found, to what extent is it different in quantity or quality from what we have seen in traditional markets for 25 years?
“Liquidity is defined as the ability to buy or sell an asset for large size without significant adverse price movement.”
This straightforward question is not so simple and has many ramifications. Indeed if you can qualify and quantify liquidity, then you should be able to execute better (i.e. with smaller adverse price movement). Therefore whoever starts with order book analysis should be ready to go all the way to real-time “smart” order routing.
We are not the ones at SUN ZU to shy away from a challenge like this, so we decided to take the first step and share our results regularly. Among the many insights we will explore and comment, we would like to start with a fundamental element: order book distribution.
The chart below shows how liquidity aggregates (those are excerpts from our first public research report available here) around mid-price. To get a sense of this, we plotted the distribution of orders in the BTC/USD order book for three exchanges (Coinbase, Bitstamp, and Kraken) and averaged the results for the first half of September:
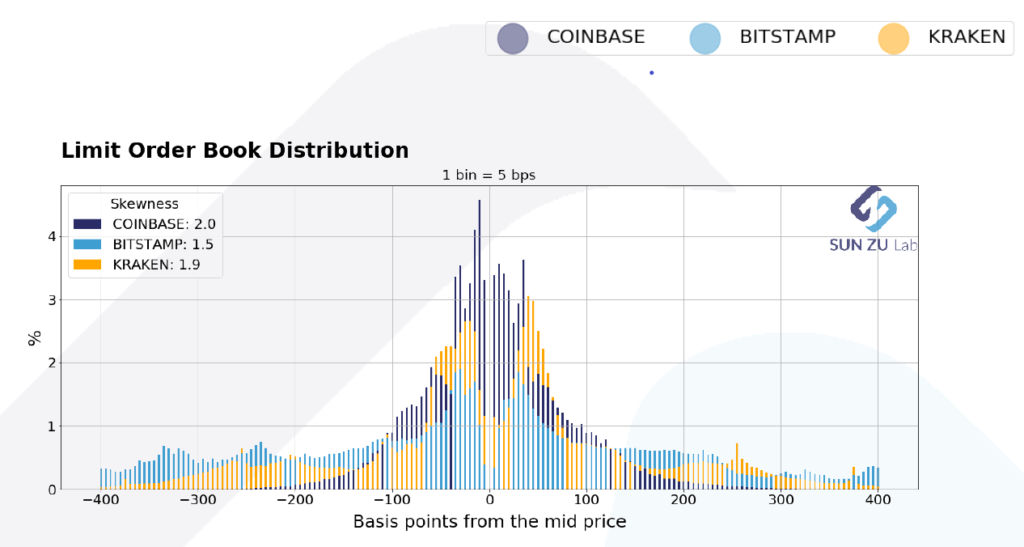
Order book distribution at +/- 400 bps from mid-price. Data from Kaiko.com.
This chart reads as follows: each bar represents the proportion (in %) of orders found at the given distance from mid-price (mid = (bid + ask) / 2). for example a 0.7% bar at -150 bps indicates that 0.7% of all orders in the price interval [-4%; +4%] can be found 1.5% below the mid-price. By construction, for each exchange, the sum of all bars equals 100%.
In fact, the above chart is the superposition of three individual pictures:
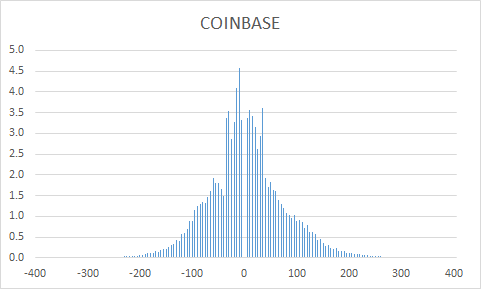
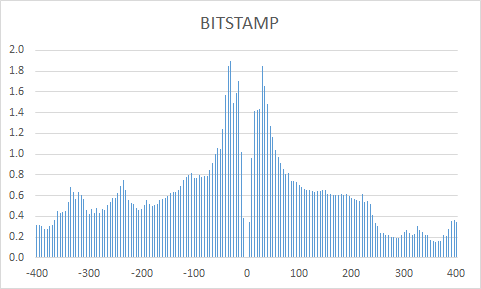
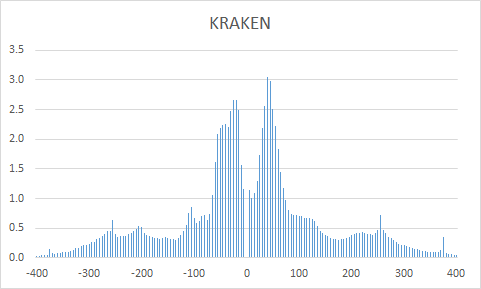
The benefit of layering the three graphs is to present an aggregate view of liquidity, and its partition across the three exchanges, with a single scale and a clear color-coding.
If we focus on a smaller interval, say [-1%; 1%], we get the following distribution:
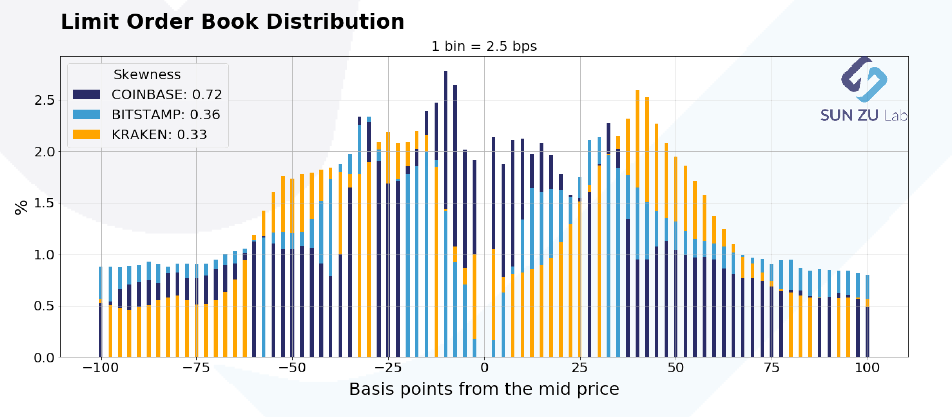
Order book distribution at +/- 100 bps from mid-price. Data from Kaiko.com.
As before, this image is the results of layering three individual charts:
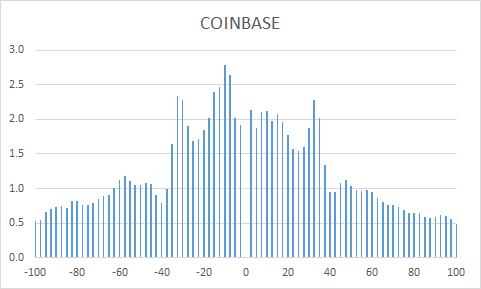
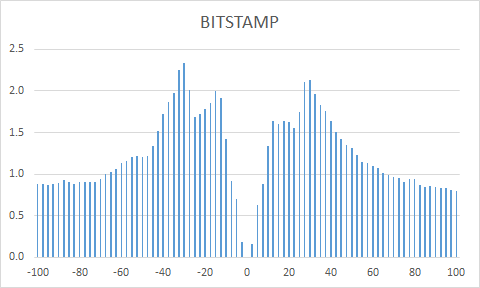
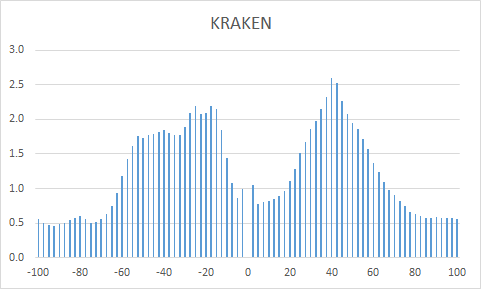
What’s the point of those charts? Why did we choose to aggregate data across exchanges and average through time? Well, the intent is to measure behavioral patterns from investors, on individual exchanges, and across the entire market (represented here by only three exchanges, more are coming). Here are a few points of interest:
- bell-shape curve: does a bell-shape curve make sense? Yes indeed: it is quite intuitive that the density of orders decreases away from the place where the action is taking place i.e. the mid-price. Yet differences are quite obvious when approaching mid-price: in some cases the available size in the book increases, in other cases it decreases. For example, the spread is much narrower on Coinbase than on Bitstamp or Kraken, it almost looks as if investors on Bitstmap wanted to stay away from the first limits in the book. Indeed, we intend to put much more work investigating those questions to deliver qualitative and quantitative insights that can help investors better understand and execute their transactions.
- speed of decay: is there information to be extracted from the speed at which liquidity decays? Absolutely: in a world of high volatility, many investors will want to place orders far away from trading levels to benefit from violent moves. This type of strategy is common in statistical arbitrage, it would be a surprise not to see something similar emerging in crypto-land. The “fatness” of the tails also serves as an indicator of “latent” liquidity i.e. orders waiting to be filled under proper circumstances.
- symmetry: is there a fundamental reason why those distributions should be symmetrical? Well, yes and no. Market makers tend to be symmetrical in the way they place orders. There is little sense in providing liquidity on one side and not the other (if you happen to have a commitment to provide liquidity you don’t have a choice in fact). Native buyers or sellers will on the contrary place themselves on one side or the other. Their relative proportion might therefore alter the symmetry of the order book. However, this relationship is severely weakened in a world where market manipulation is widespread: anybody can put massive orders for no other purpose than “window dressing” the book. Here again, more analysis is required to understand order-book dynamics.
- relative values between exchanges: exchanges have very different order books. Explanations for this can be diverse: fee structure, market-making schemes with specific obligations, more or less stringent market surveillance, minimum trading or maximum holding size, availability of leverage, etc. Because trading on a given exchange still requires fiat and crypto deposits and implies custody risk, comparing liquidity at different exchanges is quite important to choose a few in the many available.
- time-dependency: the data here is for the first half of September. SUN ZU Lab will produce those reports regularly, enabling comparison from one period to the next. If things change, for individual exchanges or on aggregate, it may indicate that liquidity is increasing, decreasing, or shifting places. Certainly something worth knowing.
- absolute vs. relative distribution: we have shown here relative distributions, i.e. no mention is made of the absolute size available in the respective order books. Also, we have looked at one asset only, BTC. Well, there’s only so much we can do here. Bear with us, we have much more to say on those subjects!!
Welcome to the wonderful world of liquidity analysis!
Everything you’ve always wanted to ask your crypto exchange

Whoever has been working in an investment bank knows that regulation is a big deal, even more so after 2008. By contrast, the world of digital assets is largely unregulated.
What is regulation anyway, why does it even exist? It could be argued that regulators worldwide have a single objective: to protect investors, small and big alike. What do investors need protection from? For the sake of simplicity let’s abstract this to the simplest notion : “information asymmetry”. Financial markets deal with information, assimilating information into price to obtain the “fair price” of a product or service. Information asymmetry means that one of the parties to a transaction knows more (or understands better) than the other, and as a result the price formed during that transaction is biased, resulting in a transfer of wealth from the less knowledgeable to the more knowledgeable.
“For those tempted to believe morons should lose their shirt, let me offer the following proposition: you always are somebody else’s moron.“
The information or knowledge we are talking about is somewhat specific. Two investors may differ in their belief that a particular situation will occur (for example XYZ stock price will go up), as a result will take different risks. Fine. But if a trader sells a complex product to a retail investor, it is most certain that the former has much better understanding of the associated risks, and may not be entirely forthcoming about those. This is the kind of asymmetry regulation is meant to address.
Coming back to the above transfer of wealth, one might argue the “fairness” of that transfer – which may or may not be part of the regulator’s mandate. What is beyond doubt however is that the global allocation of resources in the economy will be biased as well, resulting in inefficient and sub-optimal development (or unacceptable risks for unsophisticated investors). It comes as no surprise then that regulators’ first weapon is transparency, expressed as a disclosure obligation. After all the best way to make sure that everybody is on the same page is to force the more knowledgeable party to share information. That is exactly what has happened in the past 10 years in the realm of traditional markets. Disclosure goes a long way: from traders having to disclose their profit margin to clients, to financial institutions having to disclose employee compensation.
* * *
If we turn to the mostly unregulated digital eco-system, we should certainly ask the same question: if regulation served a purpose in traditional markets, specifically around the theme of transparency, shouldn’t we apply the same standards for the benefit of the largest number of investors? Presumably those would feel better protected and would increase their activity. In addition this sense of security would probably convince “by-standers” to join in.
Many argue regulation stifles innovation. But would transparency stifle innovation?
Well I confess that in my view transparency, whether volontary or imposed, is a fundamental component of “fair and orderly” markets, so I certainly hope we’ll see more of it. And in fact we might as well start looking for it right away.
If you were a trader in an investment bank, trying to become member of a new exchange, you would face a barrage of questions from all fronts: management, risk and compliance, even tax and accounting. Have you asked your crypto exchange the same questions? If those are legitimate for a regular exchange, why wouldn’t they be for any kind of marketplace? So what kind of information would a trader want to acquire i.e. what kind of question would you be wise to ask your crypto exchange (or any other intermediary for that matter)?
Let’s distinguish trading and non-trading. The table below gives a non-exhaustive list of non-trading relevant information:
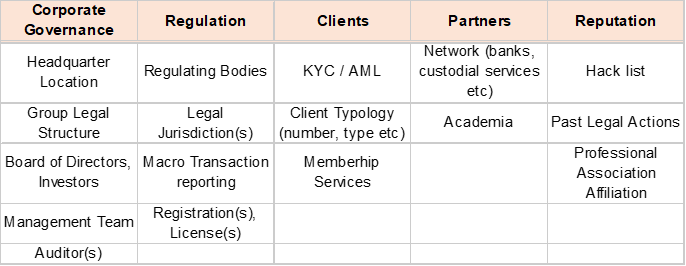
It all has to do with common sense curiosity: who am I dealing with? what economic interests am I facing, what kind of legal protection am I entitled to (if any)? Does the exchange have a history of reputational issues such as hacking? What is the qualification of the management team and what governance are they facing?
It is not the point here to detail all the items, but to give a sense of the extent of information regulators would want you to have under the “disclosure” obligation before you open a new business relationship. By the way exchanges also want to know who they’re dealing with, that’s the point of KYC investigation. It’s only fair you/we return the questions.
One item might be surprising: “academia”. Well, believe it or not it is far-reaching. Many scandals in financial markets (and elsewhere) have emerged from the work of independent researchers. Exchanges worldwide routinely provide confidential trading data to the academic world to facilitate applied financial research. Such data is incidentally also made available to national regulators.
Is that mass of information readily available from traditional exchanges? Absolutely, it may not be 100% present on their web site (here or here for example), but it is available to clients and qualified prospects. Is it readily available for crypto exchanges? No, not by a long stretch. Should it be? Well, in the absence of legal obligation, it is anybody’s call. One could argue however that disclosure goes a long way in establishing trust.
Next chapter, trading. Surely one needs to be well-informed about an exchange to be able to trade smartly. Like before, below is a non-exhaustive list of things you might want to know before transacting:
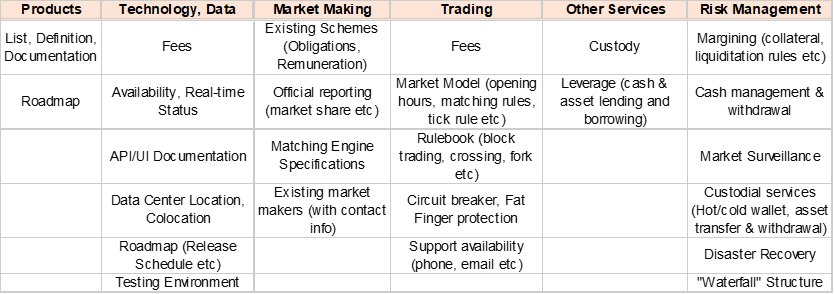
All in all, we are getting to the core of what an exchange is. There are very few cells in that table that are not highly relevant to the quality of service the exchange is able to deliver its clients. You might be tempted to consider some of those buckets are for professionals only, and that is indeed absolutely true. Then again, if professional traders conclude their due diligence favorably, chances are that any and all market participants will experience a higher quality of service.
Is that mass of information readily available from traditional exchanges? Absolutely, it may not be 100% present on their web site, but it is available to clients and qualified prospects. Is it readily available for crypto exchanges? No, not by a long stretch. Should it be? Insofar as it directly relates to the way orders, executions, risks are handled, there is little doubt here — it should be timely, accurate and exhaustive.